How to Build a React Animated Sparkline KPI Card (SVG Draw-On, Area Fade, End-Point Ping)
Published: November 11, 2026 · 10 min read
Learn how to build a React animated sparkline KPI card with SVG pathLength and stroke-dashoffset. Time the area fade, the end-point ping, and the reduced-motion fallback, then try a finished card.
A static KPI number is easy to skip
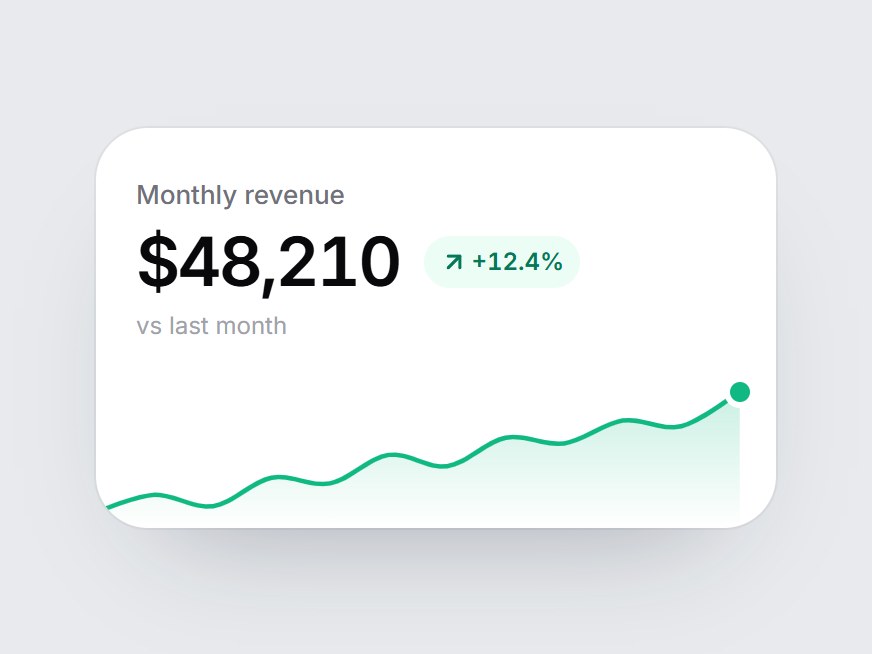
You have the number. The label is clear. The delta pill is green. On a dashboard or an analytics feature grid, people still scroll past it.
The problem is not that the metric is wrong. It is that a static figure looks like decoration — a tile that was already on the page when it loaded. Nothing points to the trend, and nothing tells the eye "this just arrived."
A sparkline fixes the first half of that. A short line under the figure shows whether the last 12 points climbed, dipped, or wobbled, without a full chart. A React animated sparkline fixes the second half: when the card enters the viewport, the line draws itself, the area fades in, and the end point lands with a small ping. The number stays the hero. The motion is only there to finish the thought.
Here is the short answer, the one you can reuse. An animated sparkline in React is an SVG path that draws itself with pathLength, stroke-dasharray, and stroke-dashoffset, usually started when the card comes into view. Fade the area after a short delay, then reveal an end point and an optional ping so the motion feels finished, not cut off. If the user prefers reduced motion, skip the transitions and show the completed line.
This guide covers:
How to turn a list of points into a smooth SVG path
How to draw the line with
stroke-dashoffset(nogetTotalLength(), no chart library)How to time the area fade, the end point, and the ping
How to start the motion with
IntersectionObserverHow to honor
prefers-reduced-motionand keep the chart readable
The timings and easing below come from a real component, Sparkline KPI Card on DesignLayer. The snippets are short and illustrative. They are not the full source.
Why homemade sparklines often look unfinished
Most teams do not fail at the math. They fail at the first second of motion.
The line is already there on first paint
If the path is visible when the component mounts, and the CSS animation starts a frame later, people see a full line that then "replays." The trick only works if the line is hidden until you decide it should draw — stroke-dashoffset at the full length, or the card still off-screen — and then you change one flag.
The area and the line start together
A fill that appears at the same time as the stroke looks like a fade, not a draw. The area should wait until the line has something to sit under. A delay of a few hundred milliseconds is enough.
Chart libraries are a lot of package for a 12-point line
Recharts, Chart.js, and Nivo are the right tool for tooltips, axes, and brushing. A KPI tile with a dozen points does not need them. A 300×76 SVG and a CSS transition will draw more cleanly, and you stay in control of easing and delay. For broader motion patterns in Next.js, see the Motion guide. This card does not use Motion at all.
Animate a sparkline with SVG pathLength, not a chart library
The approach is small on purpose.
Keep the card as a React component marked "use client". Hold one piece of state, such as drawn. Build the path from your points once. Put two SVG paths on the page: the area, then the stroke. Drive both with CSS transitions when drawn becomes true. Start that flag with an IntersectionObserver so the line is not already finished above the fold, out of sight.
pathLength is the important SVG detail. It tells the browser to treat the path as if it were a length you choose, so dash units stay stable when the card resizes. You never call getTotalLength(). The DesignLayer card uses pathLength={100} and a dash pattern of 100 100. Using pathLength={1} and dashes of 1 is the same idea; pick one scale and stay consistent.
The easing used throughout is a strong ease-out:
const EASE = "cubic-bezier(0.22, 1, 0.36, 1)";The line moves quickly at first, then settles. That is what you want for a 12-point sparkline: the trend should be obvious before the motion is over.
How to build a React animated sparkline KPI card
The card itself can stay simple: a label, a large tabular figure, a delta pill, and the sparkline under them. The DesignLayer tile is 340px wide, with a 13px label, a 34px figure, and a 76px-tall chart. Those numbers are a starting point, not a rule. What matters is the motion stack.
Step 1 — Build a smooth SVG path from your points
Map each value into a viewBox. The card uses a width of 300, a height of 76, 8px of vertical padding, and 16px of padding on the right. The right padding is not decoration. The end point is a 10px dot with a white ring, and the card clips overflow. Without that gap, the last point gets cut off.
Oldest point first. You need at least two values. Normalize against the min and max so a quiet series still uses the full height (if every point is equal, treat the span as 1).
Straight line segments look stiff on a small chart. A Catmull-Rom spline, converted to cubic Bézier segments, is enough. For each pair of points, the control points are a sixth of the way toward the neighbors:
const W = 300;
const H = 76;
const PAD_Y = 8;
const PAD_R = 16; // room so the end dot is not clipped

function point(values: readonly number[], i: number) {
  const min = Math.min(...values);
  const max = Math.max(...values);
  const span = max - min || 1;
  return {
    x: (i / (values.length - 1)) * (W - PAD_R),
    y: H - PAD_Y - ((values[i]! - min) / span) * (H - PAD_Y * 2),
  };
}

// For points p0, p1, p2, p3 (missing neighbors reuse the endpoint):
// c1 = p1 + (p2 - p0) / 6
// c2 = p2 - (p3 - p1) / 6
// then: C c1.x c1.y, c2.x c2.y, p2.x p2.y
The area path is the same d as the line, then a line to the last x at the bottom of the viewBox, then back to 0, H, then Z. Give the area a vertical gradient that fades to transparent — the DesignLayer card uses the line color at 22% opacity on top and 0 at the bottom.
Use preserveAspectRatio="none" if you want the chart to stretch to the width of the card, and overflow-visible on the SVG so the stroke caps are not shaved. Keep overflow-hidden on the card itself if you want tight corners.
Step 2 — Draw the line with stroke-dashoffset
Set pathLength={100} on the stroke. A dash array of 100 100 means one dash the length of the path, and one gap the same length. A dash offset of 100 hides the line. Animating the offset to 0 draws it from the first point to the last.
<path
  d={line}
  pathLength={100}
  fill="none"
  stroke={color}
  strokeWidth={2.25}
  strokeLinecap="round"
  strokeLinejoin="round"
  style={{
    strokeDasharray: "100 100",
    strokeDashoffset: drawn ? 0 : 100,
    transition: `stroke-dashoffset 1400ms ${EASE}`,
  }}
/>
1400ms is long enough to read the trend and short enough that a dashboard row of cards does not feel slow. Because pathLength is fixed, the duration stays the same if the card gets wider on a large screen.
Toggle drawn with React state. Do not start the transition on mount if the card might be below the fold — that is Step 4.
Step 3 — Fade the area, then land an end-point ping
The area uses a delayed opacity transition, not a second dash animation. It starts 500ms after drawn becomes true and fades in over 900ms, so it is full just as the line finishes.
<path
  d={area}
  fill={`url(#${gradientId})`}
  style={{
    opacity: drawn ? 1 : 0,
    transition: `opacity 900ms ${EASE} 500ms`,
  }}
/>
The end point is a small absolutely positioned dot, not an SVG circle. That makes the ping ring easier to do in CSS. Place it with the last point: left is (end.x / W) * 100%, and top is -(H - end.y) relative to a zero-height wrapper under the SVG. Start at scale(0.4) and opacity 0. When drawn is true, fade it in over 300ms and scale it to 1 over 420ms, both delayed by 1250ms — just before the line completes.
The ping is a child of that dot: a 1.8s animation, delayed 1.6s, repeating. It scales from 1 to 3 and fades from opacity 0.5 to 0, with the same easing. The delay is there so the pulse does not start until the line has drawn and the end point is on screen.
@keyframes sparkline-kpi-card-ping {
  0% { transform: scale(1); opacity: 0.5; }
  100% { transform: scale(3); opacity: 0; }
}
.sparkline-kpi-card-ping {
  animation: sparkline-kpi-card-ping 1.8s cubic-bezier(0.22, 1, 0.36, 1) 1.6s infinite;
}
A practical detail: if the animation class is on the element from mount, the 1.6s delay starts then, not when drawn flips. That is fine when the card is already in view. If the card sits far down the page, apply the ping class only after drawn is true so the delay lines up with the draw.
Colors follow the delta. The DesignLayer card uses #10b981 when the change is positive and #f43f5e when it is not, including the area gradient, the stroke, the dot, and the ping.
Step 4 — Start the motion when the card enters the viewport
An IntersectionObserver with a threshold of 0.35 is enough. When 35% of the card is visible, set drawn to true and disconnect. You only want the entrance once. If IntersectionObserver is missing, set drawn to true immediately so the chart is never stuck empty.
React.useEffect(() => {
  const node = ref.current;
  if (!node || typeof IntersectionObserver === "undefined") {
    setDrawn(true);
    return;
  }
  const observer = new IntersectionObserver(
    ([entry]) => {
      if (entry?.isIntersecting) {
        setDrawn(true);
        observer.disconnect();
      }
    },
    { threshold: 0.35 },
  );
  observer.observe(node);
  return () => observer.disconnect();
}, []);
This is the same idea as a scroll reveal, but the only thing it toggles is the CSS transitions you already wrote. No animation library, no scroll listener.
Step 5 — Respect reduced motion and keep the chart readable
If the user has asked the OS to reduce motion, do not draw the line or pulse the end point. Show the completed chart in one step.
@media (prefers-reduced-motion: reduce) {
  .sparkline-kpi-card-ping {
    animation: none;
    opacity: 0;
  }
}
On the paths and the end point, Tailwind's motion-reduce:!transition-none (or the same rule in your own CSS) cancels the delays. When drawn becomes true, the offset jumps to 0 and the area appears at full opacity. The ping stays hidden.
Treat the SVG as an image, not as decorative noise. The DesignLayer card uses role="img" and an aria-label in the form ${label} trend, ${values.length} points. The figure uses tabular-nums so $48,210 does not wobble if the value ever updates. The sparkline can stay aria-hidden on the end-point ping; the label on the SVG already describes the trend.
Use a finished React animated sparkline
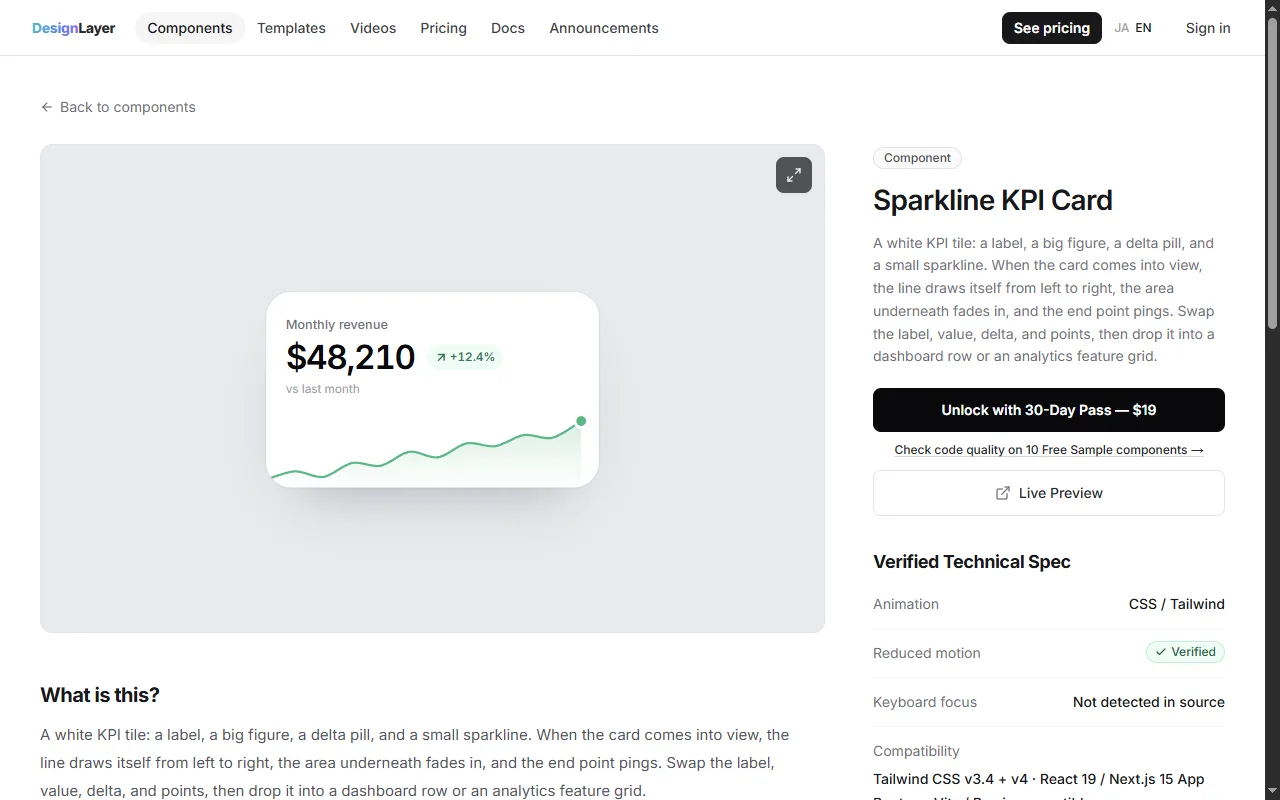
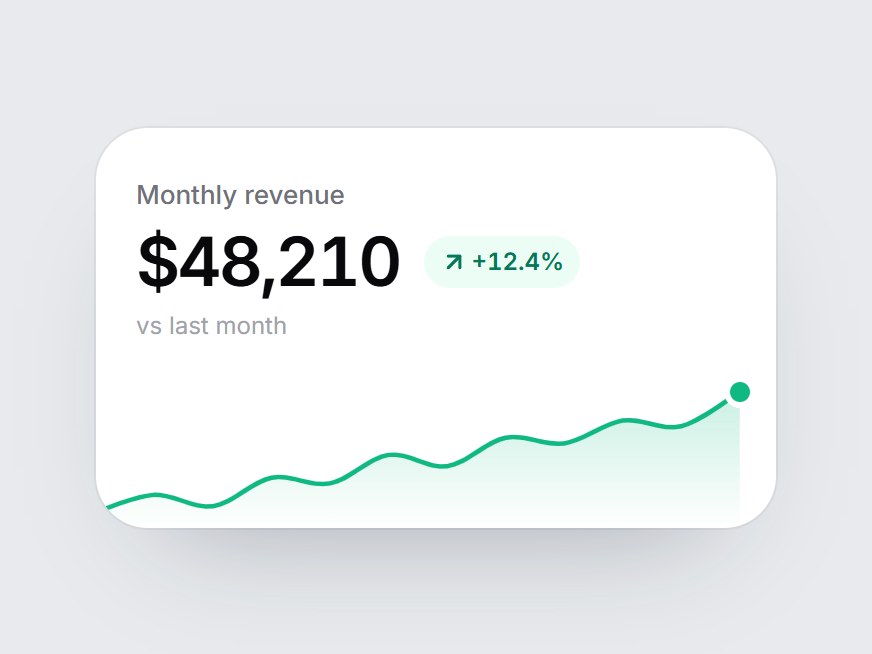
Tuning the path, the three delays, and the ping so they feel like one motion takes more time than the snippets suggest. If you want to see the finished stack before you rebuild it, open Sparkline KPI Card on DesignLayer. The live preview is the same motion this article describes: a white tile, a rising series, a green delta, the line drawing from left to right, the area fading in, and the end point pinging.
Browsing and the live preview are free. You do not need an account or a card to watch it. This component is not one of the Free Sample components. Copying its full source is included with the 30-Day Build Pass or Lifetime Access (Plus is also available if you prefer a monthly plan).
"Copy for Cursor" packages the install instructions, the live preview URL, the component TSX, and the npm list. Paste that into Cursor or Claude and drop the card into a dashboard row or an analytics feature grid. Swap the label, the formatted value, the delta, and the points.
A free account still lets you copy 10 Free Sample components with no copy cap, plus one launch-video prompt per month. Unlimited copies of the full catalog (146 components; 136 of them are Pass-only) are the 30-Day Build Pass ($19, one-time), Lifetime Access ($79, one-time, founding price for the first 100 buyers), or Plus ($9/month, cancel anytime). Confirm the current offer on Pricing before you buy. The catalog is at https://design-layer.com/en/components.
React animated sparkline FAQ
Draw an SVG path and animate
stroke-dashoffsetfrom the path length to 0. SetpathLengthso the dash units stay stable, toggle adrawnflag from anIntersectionObserver, and use a CSS transition. You do not need Recharts, Chart.js, orgetTotalLength().
Summary: a React animated sparkline KPI card in five moves
Build a smooth SVG path from your points, and leave room on the right for the end dot
Draw the stroke with
pathLengthandstroke-dashoffset, about 1400ms, ease-outFade the area after a short delay, then reveal the end point and a ping
Flip a
drawnflag withIntersectionObserver(threshold 0.35 is a solid default)For reduced motion, show the finished chart and skip the pulse
Start with Steps 2 and 4 on one tile. When the timing feels right, add the area and the ping. If you would rather try the finished card first, open Sparkline KPI Card. For Motion-based UI (this card does not use it), see the Framer Motion guide and the magnetic button guide. For the copy-into-Cursor loop, see React motion components for Cursor.