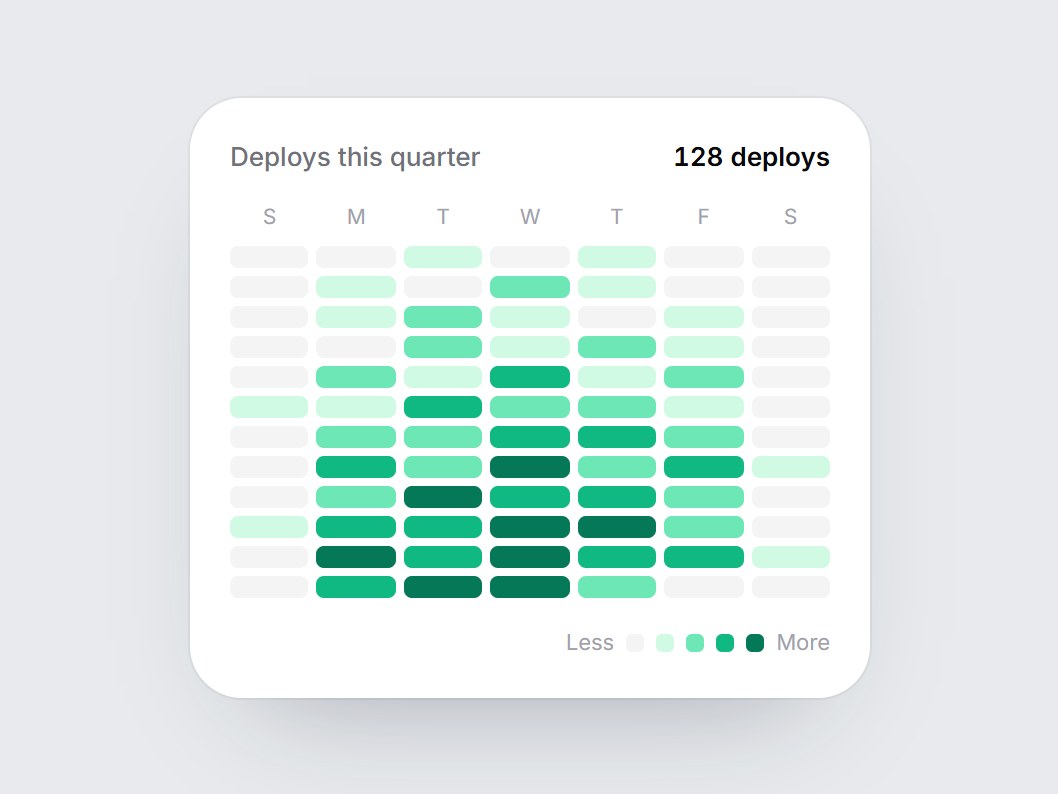
What is this?
A white card with a seven-column, twelve-week grid of rounded cells in five shades of green, plus a title and a total. When the card comes into view, the cells tint in row by row, left to right, while empty days stay gray. Swap the title, total, and values, then drop it into a deploy log, an activity overview, or an analytics feature grid.
Full TSX source. No account needed.
week-heatmap-strip.tsx
"use client"; import * as React from "react";import { cn } from "@/lib/utils"; /** 12 weeks, oldest first. Each row is Sun–Sat, 0 (none) to 4 (busiest). */export const WEEK_HEATMAP_DEFAULT_VALUES: readonly (readonly number[])[] = [ [0, 0, 1, 0, 1, 0, 0], [0, 1, 0, 2, 1, 0, 0], [0, 1, 2, 1, 0, 1, 0], [0, 0, 2, 1, 2, 1, 0], [0, 2, 1, 3, 1, 2, 0], [1, 1, 3, 2, 2, 1, 0], [0, 2, 2, 3, 3, 2, 0], [0, 3, 2, 4, 2, 3, 1], [0, 2, 4, 3, 3, 2, 0], [1, 3, 3, 4, 4, 2, 0], [0, 4, 3, 4, 3, 3, 1], [0, 3, 4, 4, 2, 0, 0],]; export type WeekHeatmapStripProps = React.ComponentPropsWithoutRef<"div"> & { title?: string; /** Total on the right of the header, e.g. "128 deploys". */ caption?: string; /** One row per week, oldest first. Each row holds seven values, Sun–Sat. */ values?: readonly (readonly number[])[]; /** Value that maps to the darkest cell. */ max?: number; /** Seven column headers, Sun–Sat. */ dayLabels?: readonly string[]; lessLabel?: string; moreLabel?: string;}; const EASE = "cubic-bezier(0.22, 1, 0.36, 1)";const CELL_MS = 400;const STAGGER_MS = 20;const EMPTY = "#f4f4f5";const LEVELS = [EMPTY, "#d1fae5", "#6ee7b7", "#10b981", "#047857"];const DEFAULT_DAY_LABELS = ["S", "M", "T", "W", "T", "F", "S"]; function levelOf(value: number, max: number) { if (value <= 0 || max <= 0) return 0; return Math.min(4, Math.max(1, Math.ceil((value / max) * 4)));} export const WeekHeatmapStrip = React.forwardRef<HTMLDivElement, WeekHeatmapStripProps>( ( { title = "Deploys this quarter", caption = "128 deploys", values = WEEK_HEATMAP_DEFAULT_VALUES, max = 4, dayLabels = DEFAULT_DAY_LABELS, lessLabel = "Less", moreLabel = "More", className, ...props }, ref, ) => { const localRef = React.useRef<HTMLDivElement>(null); React.useImperativeHandle(ref, () => localRef.current as HTMLDivElement); const [tinted, setTinted] = React.useState(false); const cells = React.useMemo( () => values.flatMap((week) => Array.from({ length: 7 }, (_, day) => levelOf(week[day] ?? 0, max)), ), [values, max], ); React.useEffect(() => { const node = localRef.current; if (!node || typeof IntersectionObserver === "undefined") { setTinted(true); return; } const observer = new IntersectionObserver( ([entry]) => { if (entry?.isIntersecting) { setTinted(true); observer.disconnect(); } }, { threshold: 0.35 }, ); observer.observe(node); return () => observer.disconnect(); }, []); return ( <div ref={localRef} data-tsuna-id="week-heatmap-strip" className={cn( "w-[340px] max-w-full rounded-[26px] bg-white p-5 text-zinc-950", "shadow-[0_30px_60px_-34px_rgba(15,23,42,0.35),0_0_0_1px_rgba(15,23,42,0.05)]", className, )} {...props} > <div className="flex items-baseline justify-between gap-3"> <span className="text-[13px] font-medium text-zinc-500">{title}</span> {caption ? ( <span className="text-[13px] font-semibold tabular-nums">{caption}</span> ) : null} </div> <div aria-hidden className="mt-4 grid grid-cols-7 gap-1"> {Array.from({ length: 7 }, (_, day) => ( <span key={day} className="text-center text-[10.5px] leading-none text-zinc-400"> {dayLabels[day] ?? ""} </span> ))} </div> <div role="img" aria-label={`${title}, ${values.length} weeks`} className="mt-2 grid grid-cols-7 gap-1" > {cells.map((level, index) => ( <span key={index} className="h-[11px] rounded-[4px] motion-reduce:!transition-none" style={{ backgroundColor: tinted ? LEVELS[level] : EMPTY, transition: level > 0 ? `background-color ${CELL_MS}ms ${EASE} ${index * STAGGER_MS}ms` : undefined, }} /> ))} </div> <div aria-hidden className="mt-3.5 flex items-center justify-end gap-1.5 text-[11px] text-zinc-400"> <span>{lessLabel}</span> {LEVELS.map((color) => ( <span key={color} className="size-[9px] rounded-[3px]" style={{ backgroundColor: color }} /> ))} <span>{moreLabel}</span> </div> </div> ); },); WeekHeatmapStrip.displayName = "WeekHeatmapStrip";
Week Heatmap Strip
A white card with a seven-column, twelve-week grid of rounded cells in five shades of green, plus a title and a total. When the card comes into view, the cells tint in row by row, left to right, while empty days stay gray. Swap the title, total, and values, then drop it into a deploy log, an activity overview, or an analytics feature grid.
Verified Technical Spec
- Animation
- CSS / Tailwind
- Reduced motion
- Verified
- Keyboard focus
- Not detected in source
- Compatibility
- Tailwind CSS v3.4 + v4 · React 19 / Next.js 15 App Router + Vite / Remix compatible
Included
- Copy source into Cursor or Claude for agent install
- Finished React · TypeScript · Tailwind CSS UI
Dependencies
- React 19.0.0
- Typescript 5.7.2
- Tailwindcss 3.4.16
Tech Stack
- React
- TypeScript
- Tailwind CSS
Version 1.0.0