コンポーネント一覧へ戻る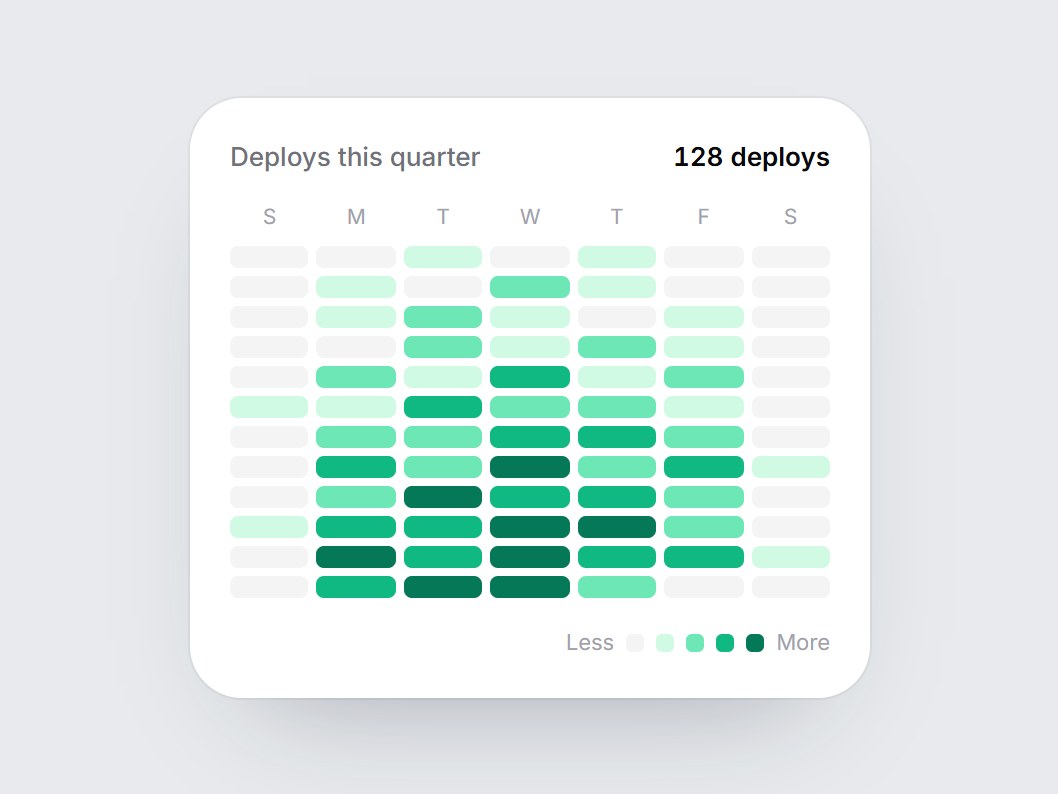
これは何か
日曜から土曜の7列を12週ぶん並べた、角丸セルのヒートマップの白いカードです。緑の濃さは5段階で、タイトルと合計が上に付きます。画面に入るとセルが行ごとに左から順に色づき、何もない日はグレーのまま残ります。タイトル・合計・値を差し替えて、デプロイ履歴やアクティビティの概要にそのまま置けます。
TSX の全文です。アカウントは不要です。
week-heatmap-strip.tsx
"use client"; import * as React from "react";import { cn } from "@/lib/utils"; /** 12 weeks, oldest first. Each row is Sun–Sat, 0 (none) to 4 (busiest). */export const WEEK_HEATMAP_DEFAULT_VALUES: readonly (readonly number[])[] = [ [0, 0, 1, 0, 1, 0, 0], [0, 1, 0, 2, 1, 0, 0], [0, 1, 2, 1, 0, 1, 0], [0, 0, 2, 1, 2, 1, 0], [0, 2, 1, 3, 1, 2, 0], [1, 1, 3, 2, 2, 1, 0], [0, 2, 2, 3, 3, 2, 0], [0, 3, 2, 4, 2, 3, 1], [0, 2, 4, 3, 3, 2, 0], [1, 3, 3, 4, 4, 2, 0], [0, 4, 3, 4, 3, 3, 1], [0, 3, 4, 4, 2, 0, 0],]; export type WeekHeatmapStripProps = React.ComponentPropsWithoutRef<"div"> & { title?: string; /** Total on the right of the header, e.g. "128 deploys". */ caption?: string; /** One row per week, oldest first. Each row holds seven values, Sun–Sat. */ values?: readonly (readonly number[])[]; /** Value that maps to the darkest cell. */ max?: number; /** Seven column headers, Sun–Sat. */ dayLabels?: readonly string[]; lessLabel?: string; moreLabel?: string;}; const EASE = "cubic-bezier(0.22, 1, 0.36, 1)";const CELL_MS = 400;const STAGGER_MS = 20;const EMPTY = "#f4f4f5";const LEVELS = [EMPTY, "#d1fae5", "#6ee7b7", "#10b981", "#047857"];const DEFAULT_DAY_LABELS = ["S", "M", "T", "W", "T", "F", "S"]; function levelOf(value: number, max: number) { if (value <= 0 || max <= 0) return 0; return Math.min(4, Math.max(1, Math.ceil((value / max) * 4)));} export const WeekHeatmapStrip = React.forwardRef<HTMLDivElement, WeekHeatmapStripProps>( ( { title = "Deploys this quarter", caption = "128 deploys", values = WEEK_HEATMAP_DEFAULT_VALUES, max = 4, dayLabels = DEFAULT_DAY_LABELS, lessLabel = "Less", moreLabel = "More", className, ...props }, ref, ) => { const localRef = React.useRef<HTMLDivElement>(null); React.useImperativeHandle(ref, () => localRef.current as HTMLDivElement); const [tinted, setTinted] = React.useState(false); const cells = React.useMemo( () => values.flatMap((week) => Array.from({ length: 7 }, (_, day) => levelOf(week[day] ?? 0, max)), ), [values, max], ); React.useEffect(() => { const node = localRef.current; if (!node || typeof IntersectionObserver === "undefined") { setTinted(true); return; } const observer = new IntersectionObserver( ([entry]) => { if (entry?.isIntersecting) { setTinted(true); observer.disconnect(); } }, { threshold: 0.35 }, ); observer.observe(node); return () => observer.disconnect(); }, []); return ( <div ref={localRef} data-tsuna-id="week-heatmap-strip" className={cn( "w-[340px] max-w-full rounded-[26px] bg-white p-5 text-zinc-950", "shadow-[0_30px_60px_-34px_rgba(15,23,42,0.35),0_0_0_1px_rgba(15,23,42,0.05)]", className, )} {...props} > <div className="flex items-baseline justify-between gap-3"> <span className="text-[13px] font-medium text-zinc-500">{title}</span> {caption ? ( <span className="text-[13px] font-semibold tabular-nums">{caption}</span> ) : null} </div> <div aria-hidden className="mt-4 grid grid-cols-7 gap-1"> {Array.from({ length: 7 }, (_, day) => ( <span key={day} className="text-center text-[10.5px] leading-none text-zinc-400"> {dayLabels[day] ?? ""} </span> ))} </div> <div role="img" aria-label={`${title}, ${values.length} weeks`} className="mt-2 grid grid-cols-7 gap-1" > {cells.map((level, index) => ( <span key={index} className="h-[11px] rounded-[4px] motion-reduce:!transition-none" style={{ backgroundColor: tinted ? LEVELS[level] : EMPTY, transition: level > 0 ? `background-color ${CELL_MS}ms ${EASE} ${index * STAGGER_MS}ms` : undefined, }} /> ))} </div> <div aria-hidden className="mt-3.5 flex items-center justify-end gap-1.5 text-[11px] text-zinc-400"> <span>{lessLabel}</span> {LEVELS.map((color) => ( <span key={color} className="size-[9px] rounded-[3px]" style={{ backgroundColor: color }} /> ))} <span>{moreLabel}</span> </div> </div> ); },); WeekHeatmapStrip.displayName = "WeekHeatmapStrip";
コンポーネント
週間ヒートマップストリップ
日曜から土曜の7列を12週ぶん並べた、角丸セルのヒートマップの白いカードです。緑の濃さは5段階で、タイトルと合計が上に付きます。画面に入るとセルが行ごとに左から順に色づき、何もない日はグレーのまま残ります。タイトル・合計・値を差し替えて、デプロイ履歴やアクティビティの概要にそのまま置けます。
Verified Technical Spec
- アニメーション
- CSS / Tailwind
- Reduced motion
- 確認済み
- キーボードフォーカス
- ソース上では未検出
- 対応環境
- Tailwind CSS v3.4 + v4 · React 19 / Next.js 15 App Router + Vite / Remix 対応
含まれるもの
- ソースを Cursor / Claude に渡してエージェントに組み込める
- React · TypeScript · Tailwind CSS の完成 UI
依存パッケージ
- React 19.0.0
- Typescript 5.7.2
- Tailwindcss 3.4.16
技術スタック
- React
- TypeScript
- Tailwind CSS
バージョン 1.0.0