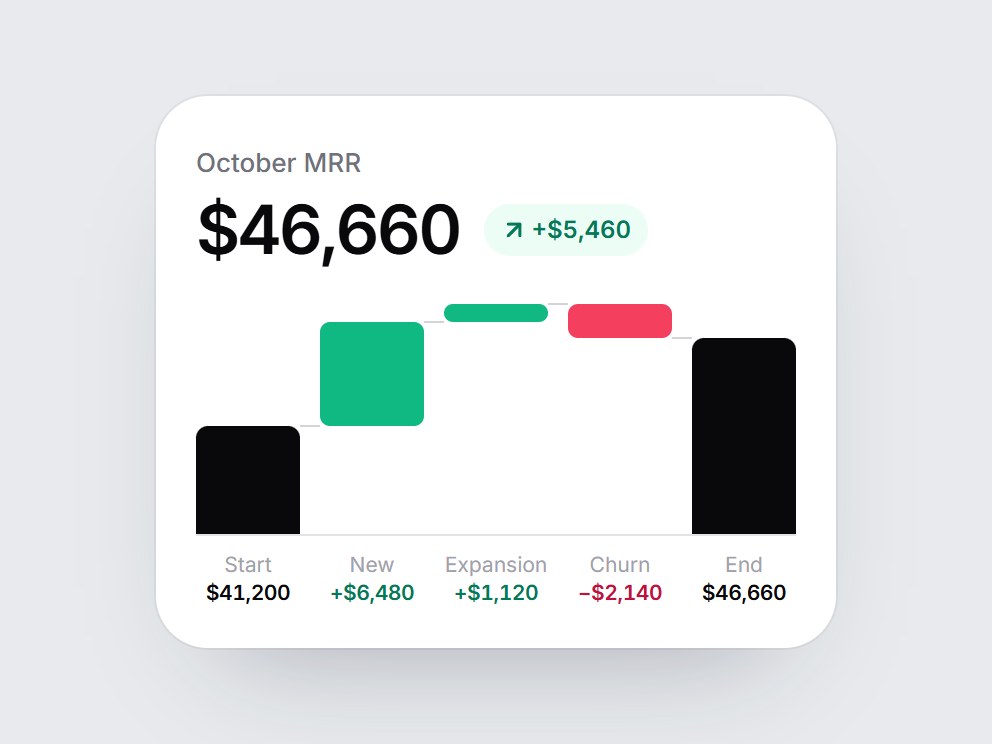
What is this?
A white MRR tile with a seven-column waterfall: Start, New, Expand, Renew, Contract, Churn, and End. When the card comes into view, the bars grow from left to right and a dashed line then joins each bar to the next. New, Expand, and Renew rise in green, Contract and Churn drop in rose, and the two totals stand from the bottom of the plot. The header shows the closing MRR and the net change. Swap the label and the amounts, then drop it into a revenue dashboard or a finance feature block.
Full TSX source. No account needed.
mrr-waterfall-card.tsx
"use client"; import * as React from "react";import { ArrowDownRight, ArrowUpRight } from "lucide-react";import { cn } from "@/lib/utils"; export const MRR_WATERFALL_DEFAULT_START = 41200;export const MRR_WATERFALL_DEFAULT_NEW = 6480;export const MRR_WATERFALL_DEFAULT_EXPANSION = 2800;export const MRR_WATERFALL_DEFAULT_REACTIVATION = 2400;export const MRR_WATERFALL_DEFAULT_CONTRACTION = 2200;export const MRR_WATERFALL_DEFAULT_CHURN = 2140; /** Bar share of its column. The other 38% is the gap the connector crosses. */const BAR_SHARE = 0.62; export type MrrWaterfallCardProps = React.ComponentPropsWithoutRef<"div"> & { label?: string; /** MRR at the start of the period. */ start?: number; /** New MRR added. */ newValue?: number; /** Expansion MRR added. */ expansion?: number; /** Reactivated MRR added. */ reactivation?: number; /** Contraction MRR removed, as a positive number. */ contraction?: number; /** Churned MRR, as a positive number. */ churn?: number; /** MRR at the end. Defaults to start + new + expansion + reactivation − contraction − churn. */ end?: number; /** Text before each amount, e.g. "$". */ prefix?: string; startLabel?: string; newLabel?: string; expansionLabel?: string; reactivationLabel?: string; contractionLabel?: string; churnLabel?: string; endLabel?: string;}; const EASE = "cubic-bezier(0.22, 1, 0.36, 1)";const COLUMN_MS = 500;const STAGGER_MS = 80;const CONNECTOR_MS = 200; type Tone = "total" | "gain" | "loss"; const FILL: Record<Tone, string> = { total: "#0a0a0a", gain: "#3fb27f", loss: "#e5484d" }; export const MrrWaterfallCard = React.forwardRef<HTMLDivElement, MrrWaterfallCardProps>( ( { label = "October MRR", start = MRR_WATERFALL_DEFAULT_START, newValue = MRR_WATERFALL_DEFAULT_NEW, expansion = MRR_WATERFALL_DEFAULT_EXPANSION, reactivation = MRR_WATERFALL_DEFAULT_REACTIVATION, contraction = MRR_WATERFALL_DEFAULT_CONTRACTION, churn = MRR_WATERFALL_DEFAULT_CHURN, end, prefix = "$", startLabel = "Start", newLabel = "New", expansionLabel = "Expand", reactivationLabel = "Renew", contractionLabel = "Contract", churnLabel = "Churn", endLabel = "End", className, ...props }, ref, ) => { const localRef = React.useRef<HTMLDivElement>(null); React.useImperativeHandle(ref, () => localRef.current as HTMLDivElement); const [drawn, setDrawn] = React.useState(false); const afterNew = start + newValue; const afterExpansion = afterNew + expansion; const afterReactivation = afterExpansion + reactivation; const afterContraction = afterReactivation - contraction; const close = end ?? afterContraction - churn; const net = close - start; const money = (n: number) => `${prefix}${Math.abs(n).toLocaleString("en-US")}`; const churnBottom = afterContraction - churn; const running = [start, afterNew, afterExpansion, afterReactivation, afterContraction, churnBottom, close]; const runningMin = Math.min(...running); const runningMax = Math.max(...running); const runningSpan = Math.max(1, runningMax - runningMin); /** Plot domain sits around the running totals, not at zero, so each step is tall. */ const domainMin = runningMin - runningSpan * 0.12; const domainMax = runningMax + runningSpan * 0.08; const level = (n: number) => ((n - domainMin) / (domainMax - domainMin)) * 100; const columns: { key: string; name: string; text: string; tone: Tone; from: number; to: number; /** Level this column shares with the one before it. */ joint?: number; }[] = [ { key: "start", name: startLabel, text: money(start), tone: "total", from: domainMin, to: start }, { key: "new", name: newLabel, text: `+${money(newValue)}`, tone: "gain", from: start, to: afterNew, joint: start }, { key: "expansion", name: expansionLabel, text: `+${money(expansion)}`, tone: "gain", from: afterNew, to: afterExpansion, joint: afterNew }, { key: "reactivation", name: reactivationLabel, text: `+${money(reactivation)}`, tone: "gain", from: afterExpansion, to: afterReactivation, joint: afterExpansion, }, { key: "contraction", name: contractionLabel, text: `−${money(contraction)}`, tone: "loss", from: afterContraction, to: afterReactivation, joint: afterReactivation, }, { key: "churn", name: churnLabel, text: `−${money(churn)}`, tone: "loss", from: churnBottom, to: afterContraction, joint: afterContraction, }, { key: "end", name: endLabel, text: money(close), tone: "total", from: domainMin, to: close, joint: close }, ]; const trackStyle = { gridTemplateColumns: `repeat(${columns.length}, minmax(0, 1fr))`, } as const; React.useEffect(() => { const node = localRef.current; if (!node || typeof IntersectionObserver === "undefined") { setDrawn(true); return; } const observer = new IntersectionObserver( ([entry]) => { if (entry?.isIntersecting) { setDrawn(true); observer.disconnect(); } }, { threshold: 0.35 }, ); observer.observe(node); return () => observer.disconnect(); }, []); const Arrow = net >= 0 ? ArrowUpRight : ArrowDownRight; const summary = columns.map((column) => `${column.name} ${column.text}`).join(", "); return ( <div ref={localRef} data-tsuna-id="mrr-waterfall-card" className={cn( "w-[440px] max-w-full rounded-[26px] bg-white p-5 text-zinc-950", "shadow-[0_30px_60px_-34px_rgba(15,23,42,0.35),0_0_0_1px_rgba(15,23,42,0.05)]", className, )} {...props} > <span className="text-[13px] font-medium text-zinc-500">{label}</span> <div className="mt-1.5 flex flex-wrap items-center gap-x-3 gap-y-1"> <span className="text-[34px] leading-none font-semibold tabular-nums tracking-[-0.04em]"> {money(close)} </span> <span className={cn( "inline-flex items-center gap-0.5 rounded-full px-2 py-1 text-[12px] font-semibold tabular-nums motion-reduce:!transition-none", net >= 0 ? "bg-emerald-50 text-emerald-700" : "bg-rose-50 text-rose-700", )} style={{ opacity: drawn ? 1 : 0, transition: `opacity 400ms ${EASE} 500ms` }} > <Arrow aria-hidden className="size-3.5" strokeWidth={2.6} /> {net >= 0 ? "+" : "−"} {money(net)} </span> </div> <div role="img" aria-label={`${label} waterfall: ${summary}`} className="relative mt-5 grid h-[116px]" style={trackStyle} > {columns.map((column, index) => { const delay = index * STAGGER_MS; const bottom = level(Math.min(column.from, column.to)); const height = Math.max(0, level(Math.max(column.from, column.to)) - bottom); const inset = `${((1 - BAR_SHARE) / 2) * 100}%`; return ( <div key={column.key} className="relative h-full min-w-0"> {column.joint !== undefined ? ( <span aria-hidden className="absolute motion-reduce:!transition-none" style={{ left: `-${inset}`, width: `${(1 - BAR_SHARE) * 100}%`, bottom: `calc(${level(column.joint)}% - 0.5px)`, height: 1, backgroundImage: "repeating-linear-gradient(90deg, #d4d4d8 0 3px, transparent 3px 5px)", clipPath: drawn ? "inset(0 0 0 0)" : "inset(0 100% 0 0)", transition: `clip-path ${CONNECTOR_MS}ms ${EASE} ${delay - STAGGER_MS + COLUMN_MS}ms`, }} /> ) : null} <div className={cn( "absolute rounded-[4px] motion-reduce:!transition-none", column.tone === "loss" ? "origin-top" : "origin-bottom", )} style={{ left: inset, width: `${BAR_SHARE * 100}%`, bottom: `${bottom}%`, height: `${height}%`, backgroundColor: FILL[column.tone], transform: `scaleY(${drawn ? 1 : 0})`, transition: `transform ${COLUMN_MS}ms ${EASE} ${delay}ms`, }} /> </div> ); })} </div> <div aria-hidden className="mt-2 grid" style={trackStyle}> {columns.map((column, index) => ( <div key={column.key} className="min-w-0 text-center motion-reduce:!transition-none" style={{ opacity: drawn ? 1 : 0, transition: `opacity 400ms ${EASE} ${index * STAGGER_MS + 200}ms`, }} > <span className="block truncate text-[10.5px] leading-[14px] text-zinc-400">{column.name}</span> <span className={cn( "block text-[10.5px] leading-[14px] font-semibold tracking-[-0.02em] whitespace-nowrap tabular-nums", column.tone === "gain" && "text-emerald-700", column.tone === "loss" && "text-rose-700", )} > {column.text} </span> </div> ))} </div> </div> ); },); MrrWaterfallCard.displayName = "MrrWaterfallCard";
MRR Waterfall Card
A white MRR tile with a seven-column waterfall: Start, New, Expand, Renew, Contract, Churn, and End. When the card comes into view, the bars grow from left to right and a dashed line then joins each bar to the next. New, Expand, and Renew rise in green, Contract and Churn drop in rose, and the two totals stand from the bottom of the plot. The header shows the closing MRR and the net change. Swap the label and the amounts, then drop it into a revenue dashboard or a finance feature block.
Verified Technical Spec
- Animation
- CSS / Tailwind
- Reduced motion
- Verified
- Keyboard focus
- Not detected in source
- Compatibility
- Tailwind CSS v3.4 + v4 · React 19 / Next.js 15 App Router + Vite / Remix compatible
Included
- Copy source into Cursor or Claude for agent install
- Finished React · TypeScript · Tailwind CSS · Lucide UI
Dependencies
- React 19.0.0
- Typescript 5.7.2
- Tailwindcss 3.4.16
- Lucide-react 1.23.0
Tech Stack
- React
- TypeScript
- Tailwind CSS
- Lucide
Version 1.0.0