What is this?
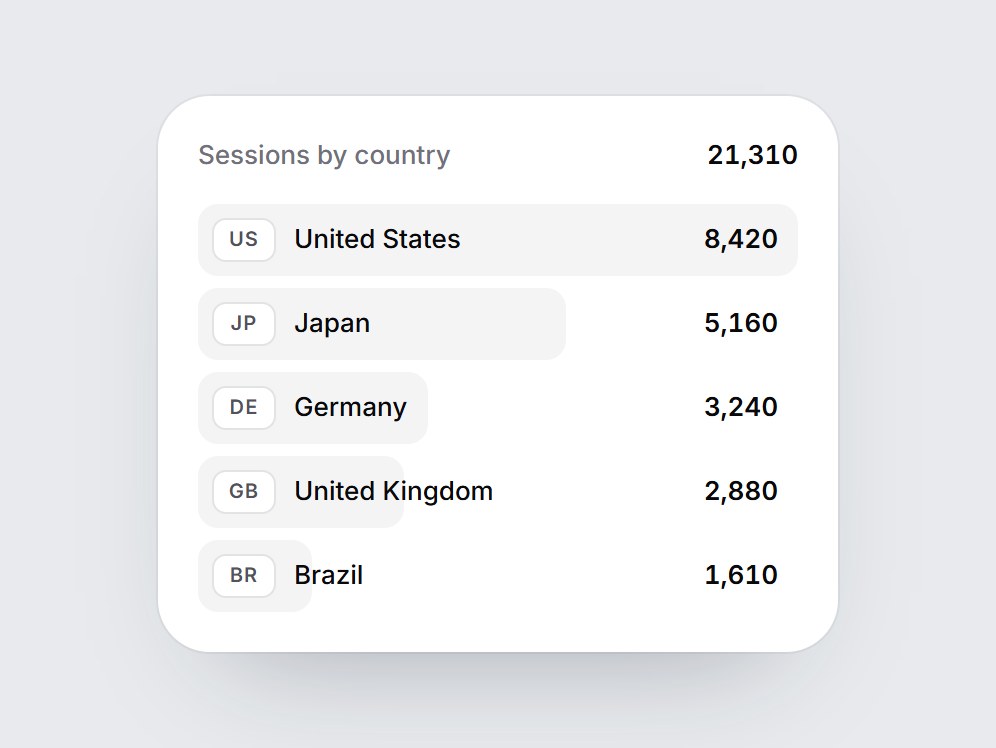
A white card of five country rows: a two-letter code chip, a name, a session count, and a soft bar behind each row. When the card comes into view, the bars grow from the left starting with the top row, and the counts fade in with them. The header shows the total. Swap the title and items, then drop it into a traffic report, a geo breakdown, or an analytics feature grid.
Full TSX source. No account needed.
country-sessions-card.tsx
"use client"; import * as React from "react";import { cn } from "@/lib/utils"; export type CountrySessionsItem = { /** Two-letter code shown in the chip, e.g. "US". */ code: string; label: string; value: number;}; export const COUNTRY_SESSIONS_DEFAULT_ITEMS: readonly CountrySessionsItem[] = [ { code: "US", label: "United States", value: 8420 }, { code: "JP", label: "Japan", value: 5160 }, { code: "DE", label: "Germany", value: 3240 }, { code: "GB", label: "United Kingdom", value: 2880 }, { code: "BR", label: "Brazil", value: 1610 },]; export type CountrySessionsCardProps = React.ComponentPropsWithoutRef<"div"> & { title?: string; /** Highest first. */ items?: readonly CountrySessionsItem[];}; const EASE = "cubic-bezier(0.22, 1, 0.36, 1)";const BAR_MS = 800;const STAGGER_MS = 80; export const CountrySessionsCard = React.forwardRef<HTMLDivElement, CountrySessionsCardProps>( ({ title = "Sessions by country", items = COUNTRY_SESSIONS_DEFAULT_ITEMS, className, ...props }, ref) => { const localRef = React.useRef<HTMLDivElement>(null); React.useImperativeHandle(ref, () => localRef.current as HTMLDivElement); const [drawn, setDrawn] = React.useState(false); const top = Math.max(1, ...items.map((item) => item.value)); const total = items.reduce((sum, item) => sum + item.value, 0); React.useEffect(() => { const node = localRef.current; if (!node || typeof IntersectionObserver === "undefined") { setDrawn(true); return; } const observer = new IntersectionObserver( ([entry]) => { if (entry?.isIntersecting) { setDrawn(true); observer.disconnect(); } }, { threshold: 0.35 }, ); observer.observe(node); return () => observer.disconnect(); }, []); return ( <div ref={localRef} data-tsuna-id="country-sessions-card" className={cn( "w-[340px] max-w-full rounded-[26px] bg-white p-5 text-zinc-950", "shadow-[0_30px_60px_-34px_rgba(15,23,42,0.35),0_0_0_1px_rgba(15,23,42,0.05)]", className, )} {...props} > <div className="flex items-baseline justify-between gap-3"> <span className="text-[13px] font-medium text-zinc-500">{title}</span> <span className="text-[13px] font-semibold tabular-nums">{total.toLocaleString("en-US")}</span> </div> <ul className="m-0 mt-3.5 flex list-none flex-col gap-1.5 p-0"> {items.map((item, index) => { const delay = index * STAGGER_MS; return ( <li key={item.code} className="relative h-9"> <span aria-hidden className="absolute inset-y-0 left-0 origin-left rounded-[10px] bg-zinc-100 motion-reduce:!transition-none" style={{ width: `${Math.max(12, (item.value / top) * 100)}%`, transform: `scaleX(${drawn ? 1 : 0})`, transition: `transform ${BAR_MS}ms ${EASE} ${delay}ms`, }} /> <div className="relative flex h-full items-center gap-2.5 pr-2.5 pl-2"> <span className="inline-flex h-5 w-[30px] shrink-0 items-center justify-center rounded-[6px] bg-white text-[10px] font-semibold tracking-[0.06em] text-zinc-600 shadow-[0_0_0_1px_rgba(15,23,42,0.08)]"> {item.code} </span> <span className="min-w-0 flex-1 truncate text-[13px] font-medium">{item.label}</span> <span className="text-[13px] font-semibold tabular-nums motion-reduce:!transition-none" style={{ opacity: drawn ? 1 : 0, transition: `opacity 400ms ${EASE} ${delay + 150}ms`, }} > {item.value.toLocaleString("en-US")} </span> </div> </li> ); })} </ul> </div> ); },); CountrySessionsCard.displayName = "CountrySessionsCard";
Country Sessions Card
A white card of five country rows: a two-letter code chip, a name, a session count, and a soft bar behind each row. When the card comes into view, the bars grow from the left starting with the top row, and the counts fade in with them. The header shows the total. Swap the title and items, then drop it into a traffic report, a geo breakdown, or an analytics feature grid.
Verified Technical Spec
- Animation
- CSS / Tailwind
- Reduced motion
- Verified
- Keyboard focus
- Not detected in source
- Compatibility
- Tailwind CSS v3.4 + v4 · React 19 / Next.js 15 App Router + Vite / Remix compatible
Included
- Copy source into Cursor or Claude for agent install
- Finished React · TypeScript · Tailwind CSS UI
Dependencies
- React 19.0.0
- Typescript 5.7.2
- Tailwindcss 3.4.16
Tech Stack
- React
- TypeScript
- Tailwind CSS
Version 1.0.0