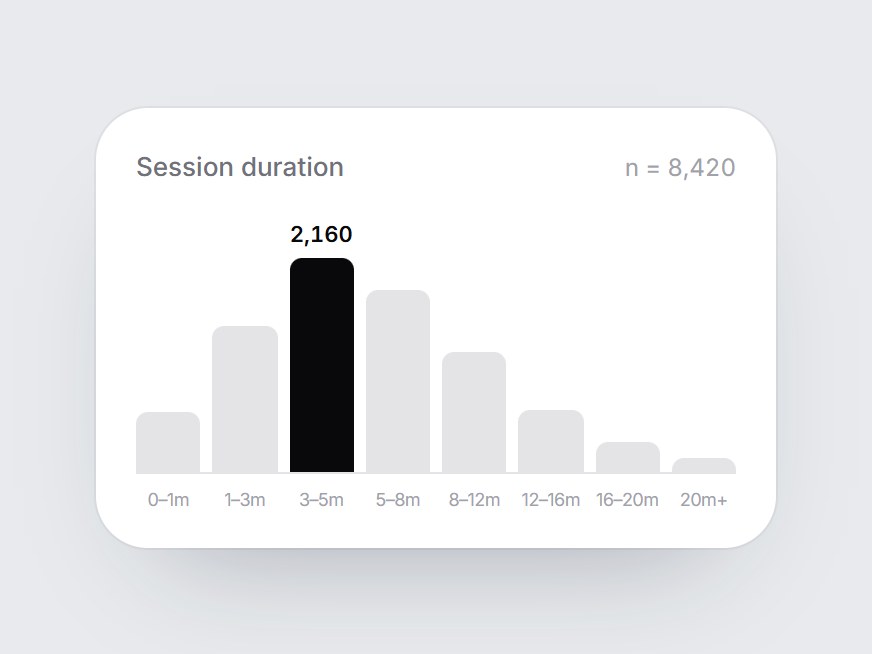
What is this?
A white distribution card: a label, a sample size, and eight columns with a range under each. When the card comes into view, the columns grow from the baseline one after another, left to right, and the tallest bin turns dark and shows its count. Swap the label, caption, and bins, then drop it into a usage report, a performance breakdown, or an analytics feature grid.
Full TSX source. No account needed.
value-histogram-card.tsx
"use client"; import * as React from "react";import { cn } from "@/lib/utils"; export type ValueHistogramBin = { /** Range under the column, e.g. "3–5m". */ label: string; value: number;}; export const VALUE_HISTOGRAM_DEFAULT_BINS: readonly ValueHistogramBin[] = [ { label: "0–1m", value: 620 }, { label: "1–3m", value: 1480 }, { label: "3–5m", value: 2160 }, { label: "5–8m", value: 1840 }, { label: "8–12m", value: 1220 }, { label: "12–16m", value: 640 }, { label: "16–20m", value: 310 }, { label: "20m+", value: 150 },]; export type ValueHistogramCardProps = React.ComponentPropsWithoutRef<"div"> & { label?: string; /** Sample size on the right of the header, e.g. "n = 8,420". */ caption?: string; /** Lowest range first. The tallest bin is drawn dark and carries its count. */ bins?: readonly ValueHistogramBin[];}; const EASE = "cubic-bezier(0.22, 1, 0.36, 1)";const BAR_MS = 750;const STAGGER_MS = 70; export const ValueHistogramCard = React.forwardRef<HTMLDivElement, ValueHistogramCardProps>( ( { label = "Session duration", caption = "n = 8,420", bins = VALUE_HISTOGRAM_DEFAULT_BINS, className, ...props }, ref, ) => { const localRef = React.useRef<HTMLDivElement>(null); React.useImperativeHandle(ref, () => localRef.current as HTMLDivElement); const [drawn, setDrawn] = React.useState(false); const top = Math.max(1, ...bins.map((bin) => bin.value)); const peakIndex = bins.findIndex((bin) => bin.value === top); const peak = bins[peakIndex]; React.useEffect(() => { const node = localRef.current; if (!node || typeof IntersectionObserver === "undefined") { setDrawn(true); return; } const observer = new IntersectionObserver( ([entry]) => { if (entry?.isIntersecting) { setDrawn(true); observer.disconnect(); } }, { threshold: 0.35 }, ); observer.observe(node); return () => observer.disconnect(); }, []); return ( <div ref={localRef} data-tsuna-id="value-histogram-card" className={cn( "w-[340px] max-w-full rounded-[26px] bg-white p-5 text-zinc-950", "shadow-[0_30px_60px_-34px_rgba(15,23,42,0.35),0_0_0_1px_rgba(15,23,42,0.05)]", className, )} {...props} > <div className="flex items-baseline justify-between gap-3"> <span className="text-[13px] font-medium text-zinc-500">{label}</span> {caption ? <span className="text-[12px] text-zinc-400 tabular-nums">{caption}</span> : null} </div> <div role="img" aria-label={`${label} distribution, ${bins.length} bins${ peak ? `, most common ${peak.label}` : "" }`} className="mt-3 flex h-[132px] items-end gap-[6px] border-b border-zinc-200 pt-6" > {bins.map((bin, index) => { const height = Math.max(2, (bin.value / top) * 100); const delay = index * STAGGER_MS; const isPeak = index === peakIndex; return ( <div key={bin.label} className="relative flex h-full min-w-0 flex-1 items-end"> {isPeak ? ( <span className="absolute left-1/2 -translate-x-1/2 text-[11px] leading-none font-semibold whitespace-nowrap tabular-nums motion-reduce:!transition-none" style={{ bottom: `calc(${height}% + 6px)`, opacity: drawn ? 1 : 0, transition: `opacity 400ms ${EASE} ${delay + BAR_MS - 200}ms`, }} > {bin.value.toLocaleString("en-US")} </span> ) : null} <div className="w-full origin-bottom rounded-t-[6px] motion-reduce:!transition-none" style={{ height: `${height}%`, backgroundColor: isPeak ? "#09090b" : "#e4e4e7", transform: `scaleY(${drawn ? 1 : 0})`, transition: `transform ${BAR_MS}ms ${EASE} ${delay}ms`, }} /> </div> ); })} </div> <div aria-hidden className="mt-2 flex gap-[6px]"> {bins.map((bin) => ( <span key={bin.label} className="min-w-0 flex-1 text-center text-[9px] leading-none tracking-[-0.03em] whitespace-nowrap text-zinc-400" > {bin.label} </span> ))} </div> </div> ); },); ValueHistogramCard.displayName = "ValueHistogramCard";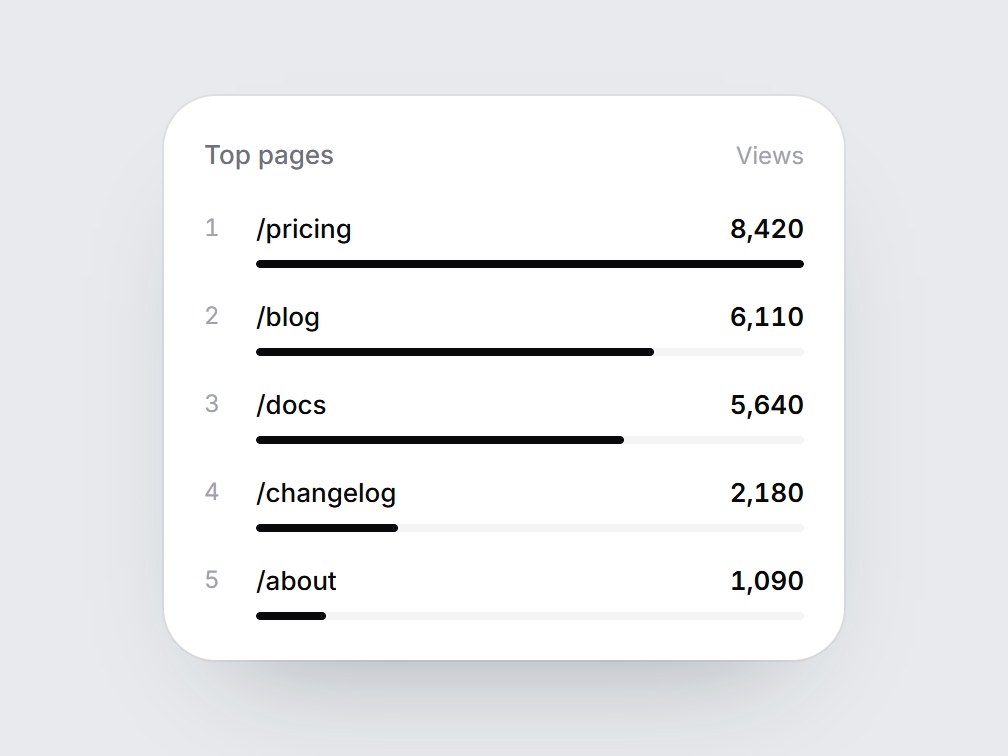
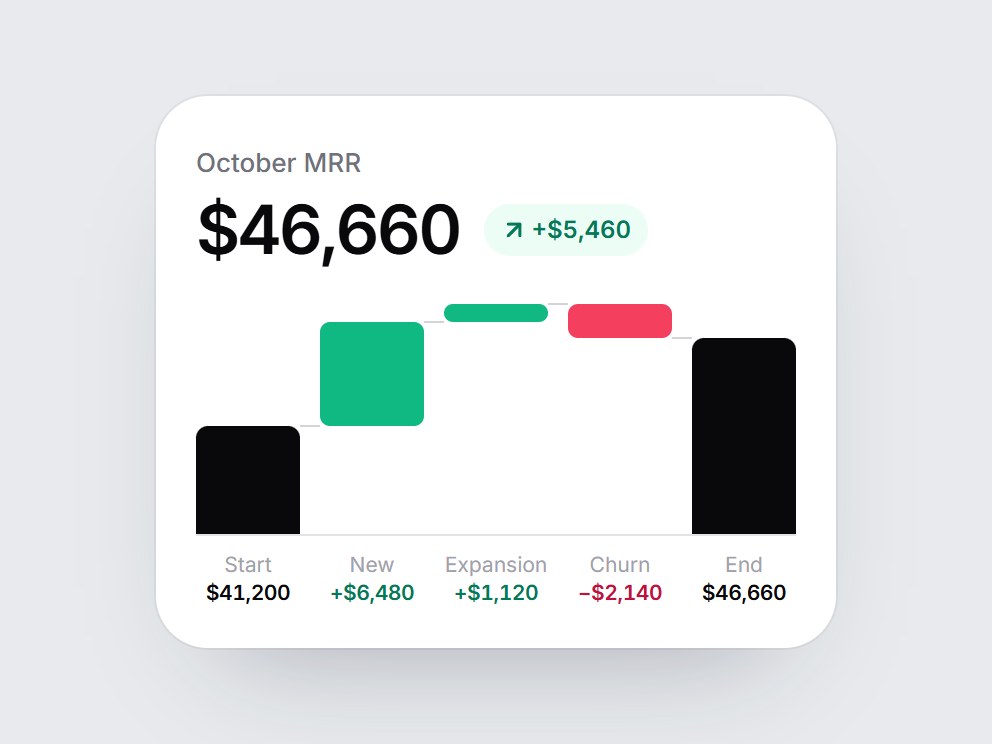
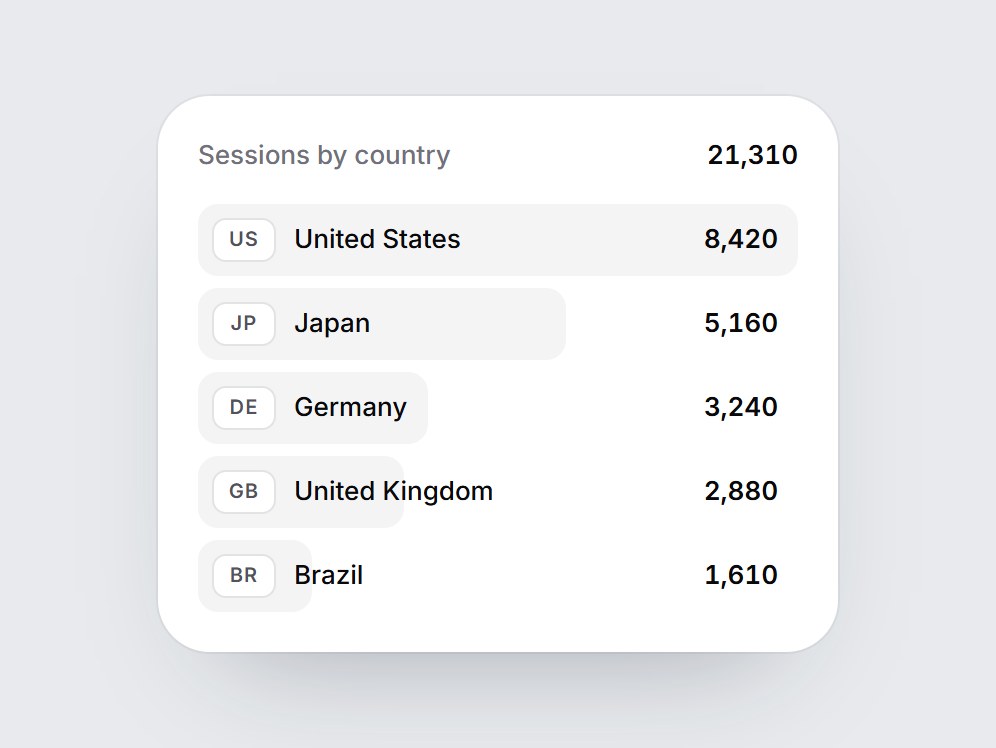
Value Histogram Card
A white distribution card: a label, a sample size, and eight columns with a range under each. When the card comes into view, the columns grow from the baseline one after another, left to right, and the tallest bin turns dark and shows its count. Swap the label, caption, and bins, then drop it into a usage report, a performance breakdown, or an analytics feature grid.
Verified Technical Spec
- Animation
- CSS / Tailwind
- Reduced motion
- Verified
- Keyboard focus
- Not detected in source
- Compatibility
- Tailwind CSS v3.4 + v4 · React 19 / Next.js 15 App Router + Vite / Remix compatible
Included
- Copy source into Cursor or Claude for agent install
- Finished React · TypeScript · Tailwind CSS UI
Dependencies
- React 19.0.0
- Typescript 5.7.2
- Tailwindcss 3.4.16
Tech Stack
- React
- TypeScript
- Tailwind CSS
Version 1.0.0