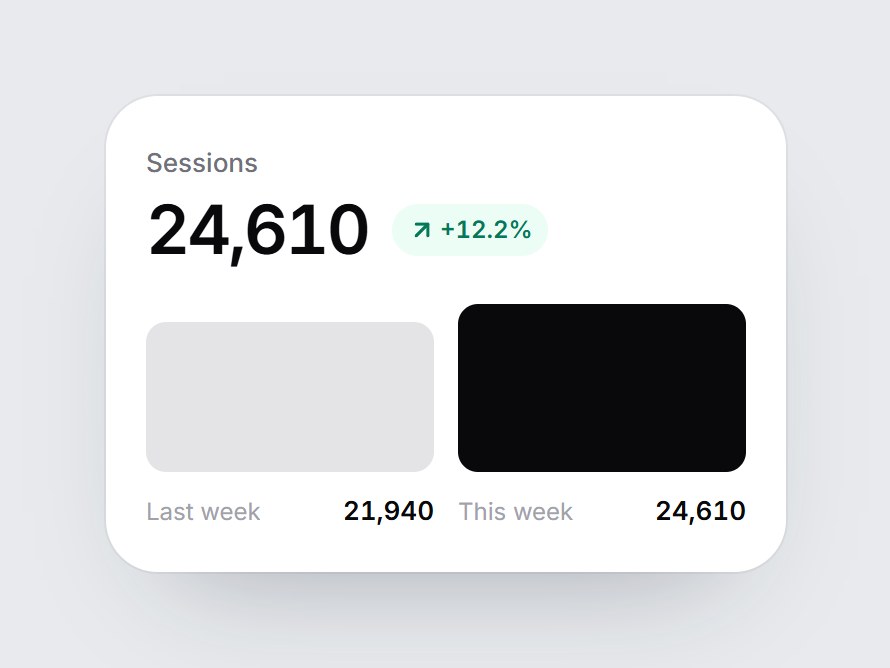
What is this?
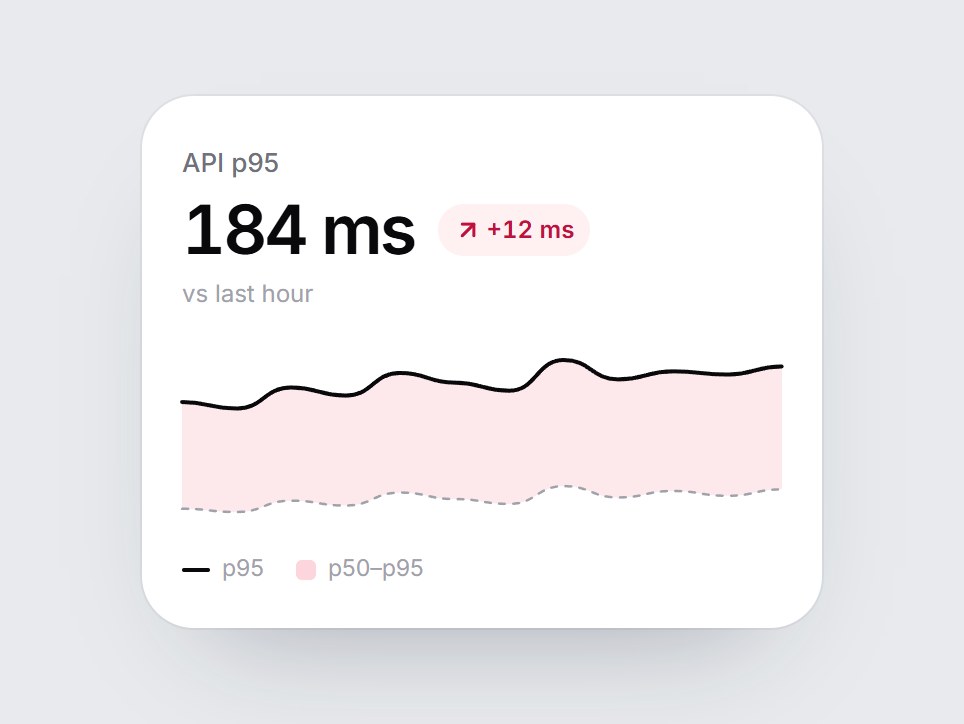
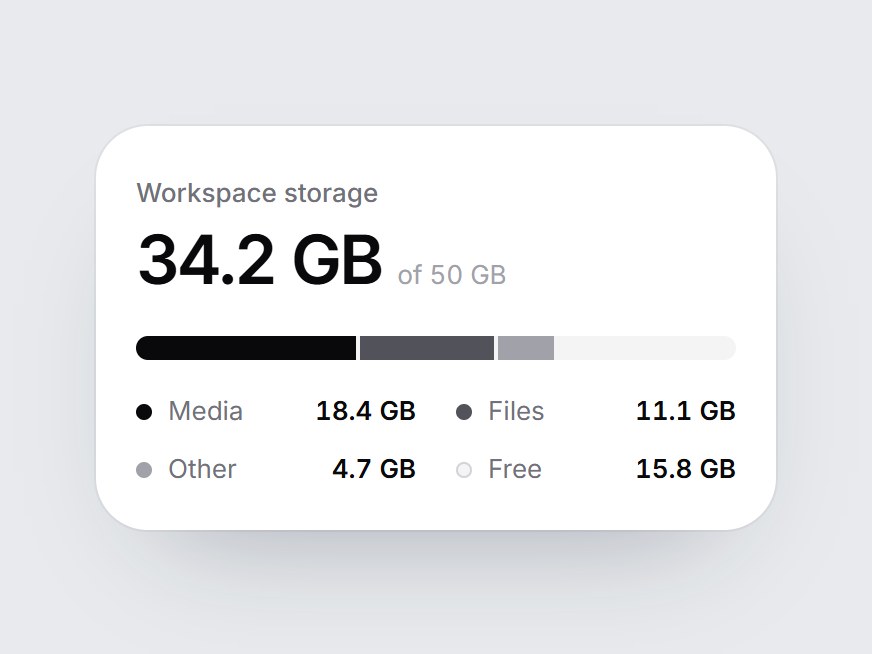
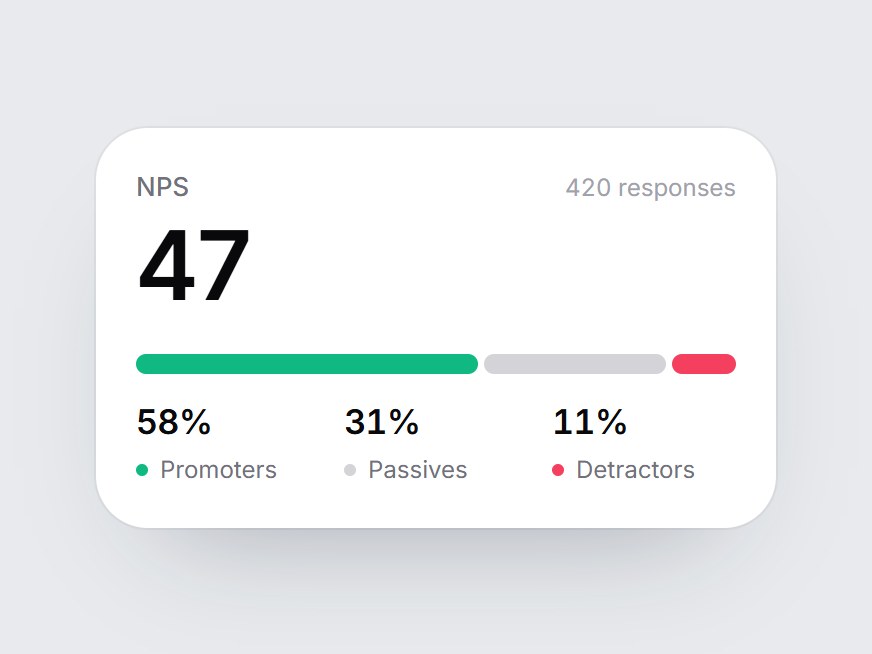
A white comparison tile: a label, a big figure, a delta pill, and two columns for last period and this period. When the card comes into view, both columns grow from the baseline to their relative heights, the figure counts up, and the delta pill fades in. Swap the label, the two values, the delta, and the period names, then drop it into a weekly report or an analytics feature grid.
Full TSX source. No account needed.
period-compare-card.tsx
"use client"; import * as React from "react";import { ArrowDownRight, ArrowUpRight } from "lucide-react";import { cn } from "@/lib/utils"; export const PERIOD_COMPARE_DEFAULT_CURRENT = 24610;export const PERIOD_COMPARE_DEFAULT_PREVIOUS = 21940; export type PeriodCompareCardProps = React.ComponentPropsWithoutRef<"div"> & { label?: string; /** This period. Counts up in the big figure. */ current?: number; /** The period before. */ previous?: number; /** Change text, e.g. "+12.2%". */ delta?: string; /** Green up arrow when true, red down arrow when false. */ positive?: boolean; currentLabel?: string; previousLabel?: string;}; const EASE = "cubic-bezier(0.22, 1, 0.36, 1)";const GROW_MS = 900;const COUNT_MS = 900; function usePrefersReducedMotion() { const [reduced, setReduced] = React.useState(false); React.useEffect(() => { const query = window.matchMedia("(prefers-reduced-motion: reduce)"); const update = () => setReduced(query.matches); update(); query.addEventListener("change", update); return () => query.removeEventListener("change", update); }, []); return reduced;} export const PeriodCompareCard = React.forwardRef<HTMLDivElement, PeriodCompareCardProps>( ( { label = "Sessions", current = PERIOD_COMPARE_DEFAULT_CURRENT, previous = PERIOD_COMPARE_DEFAULT_PREVIOUS, delta = "+12.2%", positive = true, currentLabel = "This week", previousLabel = "Last week", className, ...props }, ref, ) => { const localRef = React.useRef<HTMLDivElement>(null); React.useImperativeHandle(ref, () => localRef.current as HTMLDivElement); const reduced = usePrefersReducedMotion(); const [started, setStarted] = React.useState(false); const [count, setCount] = React.useState(0); const Arrow = positive ? ArrowUpRight : ArrowDownRight; const top = Math.max(1, current, previous); const columns = [ { key: "previous", name: previousLabel, amount: previous, color: "#e4e4e7", delay: 0 }, { key: "current", name: currentLabel, amount: current, color: "#09090b", delay: 90 }, ]; React.useEffect(() => { const node = localRef.current; if (!node || typeof IntersectionObserver === "undefined") { setStarted(true); return; } const observer = new IntersectionObserver( ([entry]) => { if (entry?.isIntersecting) { setStarted(true); observer.disconnect(); } }, { threshold: 0.35 }, ); observer.observe(node); return () => observer.disconnect(); }, []); React.useEffect(() => { if (!started) return; if (reduced) { setCount(current); return; } let frame = 0; const from = performance.now(); const tick = (now: number) => { const t = Math.min(1, (now - from) / COUNT_MS); setCount(Math.round(current * (1 - Math.pow(1 - t, 3)))); if (t < 1) frame = requestAnimationFrame(tick); }; frame = requestAnimationFrame(tick); return () => cancelAnimationFrame(frame); }, [started, reduced, current]); return ( <div ref={localRef} data-tsuna-id="period-compare-card" className={cn( "w-[340px] max-w-full rounded-[26px] bg-white p-5 text-zinc-950", "shadow-[0_30px_60px_-34px_rgba(15,23,42,0.35),0_0_0_1px_rgba(15,23,42,0.05)]", className, )} {...props} > <span className="text-[13px] font-medium text-zinc-500">{label}</span> <div className="mt-1.5 flex flex-wrap items-center gap-x-3 gap-y-1"> <span className="text-[34px] leading-none font-semibold tabular-nums tracking-[-0.04em]"> {count.toLocaleString("en-US")} </span> {delta ? ( <span className={cn( "inline-flex items-center gap-0.5 rounded-full px-2 py-1 text-[12px] font-semibold tabular-nums motion-reduce:!transition-none", positive ? "bg-emerald-50 text-emerald-700" : "bg-rose-50 text-rose-700", )} style={{ opacity: started ? 1 : 0, transition: `opacity 400ms ${EASE} 500ms` }} > <Arrow aria-hidden className="size-3.5" strokeWidth={2.6} /> {delta} </span> ) : null} </div> <div role="img" aria-label={`${label}: ${currentLabel} ${current.toLocaleString("en-US")}, ${previousLabel} ${previous.toLocaleString("en-US")}`} className="mt-5 grid grid-cols-2 gap-3" > {columns.map((column) => ( <div key={column.key} className="min-w-0"> <div className="flex h-[84px] items-end"> <div className="w-full origin-bottom rounded-[10px] motion-reduce:!transition-none" style={{ height: `${Math.max(4, (column.amount / top) * 100)}%`, backgroundColor: column.color, transform: `scaleY(${started ? 1 : 0})`, transition: `transform ${GROW_MS}ms ${EASE} ${column.delay}ms`, }} /> </div> <div className="mt-2.5 flex items-baseline justify-between gap-2"> <span className="truncate text-[12px] text-zinc-400">{column.name}</span> <span className="text-[13px] font-semibold tabular-nums"> {column.amount.toLocaleString("en-US")} </span> </div> </div> ))} </div> </div> ); },); PeriodCompareCard.displayName = "PeriodCompareCard";
Period Compare Card
A white comparison tile: a label, a big figure, a delta pill, and two columns for last period and this period. When the card comes into view, both columns grow from the baseline to their relative heights, the figure counts up, and the delta pill fades in. Swap the label, the two values, the delta, and the period names, then drop it into a weekly report or an analytics feature grid.
Verified Technical Spec
- Animation
- CSS / Tailwind
- Reduced motion
- Verified
- Keyboard focus
- Not detected in source
- Compatibility
- Tailwind CSS v3.4 + v4 · React 19 / Next.js 15 App Router + Vite / Remix compatible
Included
- Copy source into Cursor or Claude for agent install
- Finished React · TypeScript · Tailwind CSS · Lucide UI
Dependencies
- React 19.0.0
- Typescript 5.7.2
- Tailwindcss 3.4.16
- Lucide-react 1.23.0
Tech Stack
- React
- TypeScript
- Tailwind CSS
- Lucide
Version 1.0.0