コンポーネント一覧へ戻る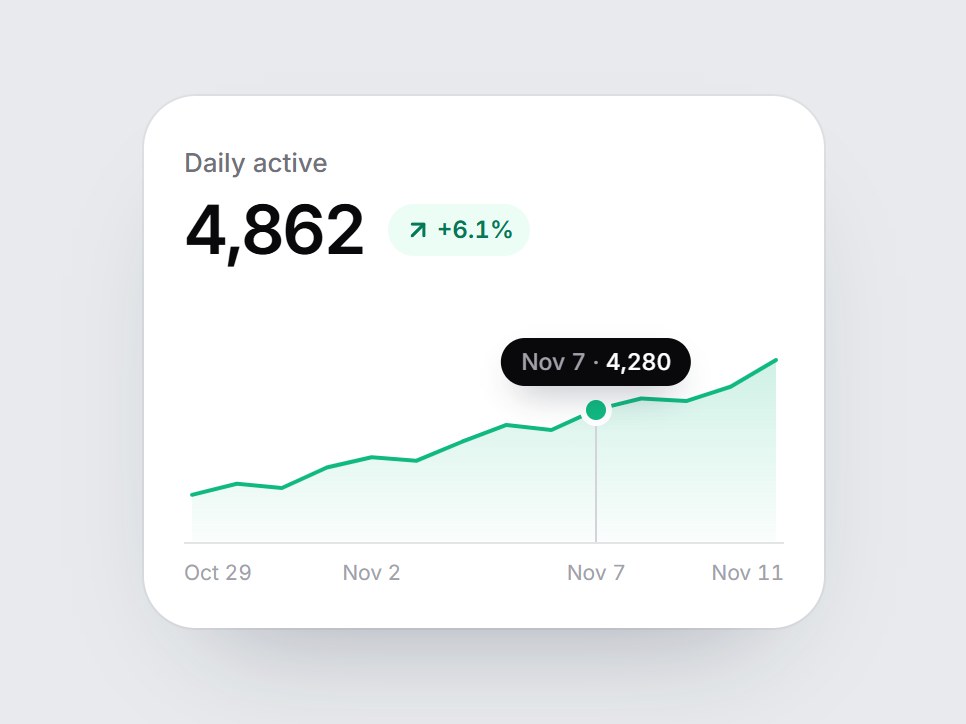
これは何か
14日ぶんの塗りつぶしエリアグラフに、控えめな基準線と日付の目盛り、ツールチップが付いた白い KPI カードです。画面に入ると面がふわっと現れ、上の線が左から描かれます。日にちにホバーするか、グラフにフォーカスして矢印キーを押すと、その日の日付と値が小さなツールチップに出ます。ラベル・値・増減・データ点・日付を差し替えて、ダッシュボードの一列や分析機能の紹介にそのまま置けます。
TSX の全文です。アカウントは不要です。
area-tooltip-card.tsx
"use client"; import * as React from "react";import { ArrowDownRight, ArrowUpRight } from "lucide-react";import { cn } from "@/lib/utils"; export const AREA_TOOLTIP_DEFAULT_POINTS: readonly number[] = [ 3280, 3410, 3360, 3600, 3720, 3680, 3900, 4100, 4040, 4280, 4410, 4380, 4550, 4862,]; export const AREA_TOOLTIP_DEFAULT_DATES: readonly string[] = [ "Oct 29", "Oct 30", "Oct 31", "Nov 1", "Nov 2", "Nov 3", "Nov 4", "Nov 5", "Nov 6", "Nov 7", "Nov 8", "Nov 9", "Nov 10", "Nov 11",]; export type AreaTooltipCardProps = React.ComponentPropsWithoutRef<"div"> & { label?: string; /** Pre-formatted figure, e.g. "4,862". */ value?: React.ReactNode; /** Change text, e.g. "+6.1%". */ delta?: string; /** Green line and up arrow when true, red when false. */ positive?: boolean; /** Oldest first. 2+ values. */ points?: readonly number[]; /** One label per point, shown on the axis and in the tooltip. */ dates?: readonly string[]; /** Point whose tooltip shows while nothing is hovered or focused. */ defaultActiveIndex?: number | null; /** Controlled highlighted point. Pass null to hide the tooltip. */ activeIndex?: number | null; onActiveIndexChange?: (index: number | null) => void; /** Text before the tooltip value, e.g. "$". */ valuePrefix?: string; /** Text after the tooltip value, e.g. " users". */ valueSuffix?: string;}; const EASE = "cubic-bezier(0.22, 1, 0.36, 1)";const LINE_MS = 1200;const W = 300;const H = 104;const PAD_X = 4;const PAD_TOP = 12;const BASE = H - 1; const CSS = `@keyframes area-tooltip-card-tip { 0% { opacity: 0; margin-top: 4px; } 100% { opacity: 1; margin-top: 0; } }.area-tooltip-card-tip { animation: area-tooltip-card-tip 220ms cubic-bezier(0.22, 1, 0.36, 1) both; }@media (prefers-reduced-motion: reduce) { .area-tooltip-card-tip { animation: none; } }`; function round(n: number) { return Math.round(n * 100) / 100;} function layout(values: readonly number[]) { const min = Math.min(...values); const max = Math.max(...values); const span = max - min || 1; const floor = min - span * 0.35; const pts = values.map((v, i) => ({ x: round(PAD_X + (i / (values.length - 1)) * (W - PAD_X * 2)), y: round(PAD_TOP + (1 - (v - floor) / (max - floor)) * (BASE - PAD_TOP)), })); const line = pts.map((p, i) => `${i === 0 ? "M" : "L"} ${p.x} ${p.y}`).join(" "); const first = pts[0] ?? { x: 0, y: BASE }; const last = pts[pts.length - 1] ?? { x: W, y: BASE }; return { pts, line, area: `${line} L ${last.x} ${BASE} L ${first.x} ${BASE} Z` };} /** Up to four evenly spaced axis labels, always including both ends. */function axisTicks(count: number) { const picks = [0, 1, 2, 3].map((i) => Math.round((i * (count - 1)) / 3)); return [...new Set(picks)];} function usePrefersReducedMotion() { const [reduced, setReduced] = React.useState(false); React.useEffect(() => { const query = window.matchMedia("(prefers-reduced-motion: reduce)"); const update = () => setReduced(query.matches); update(); query.addEventListener("change", update); return () => query.removeEventListener("change", update); }, []); return reduced;} export const AreaTooltipCard = React.forwardRef<HTMLDivElement, AreaTooltipCardProps>( ( { label = "Daily active", value = "4,862", delta = "+6.1%", positive = true, points = AREA_TOOLTIP_DEFAULT_POINTS, dates = AREA_TOOLTIP_DEFAULT_DATES, defaultActiveIndex = null, activeIndex, onActiveIndexChange, valuePrefix = "", valueSuffix = "", className, ...props }, ref, ) => { const values = points.length >= 2 ? points : AREA_TOOLTIP_DEFAULT_POINTS; const { pts, line, area } = React.useMemo(() => layout(values), [values]); const ticks = React.useMemo(() => axisTicks(values.length), [values.length]); const localRef = React.useRef<HTMLDivElement>(null); React.useImperativeHandle(ref, () => localRef.current as HTMLDivElement); const reduced = usePrefersReducedMotion(); const [drawn, setDrawn] = React.useState(false); const [settled, setSettled] = React.useState(false); const [picked, setPicked] = React.useState<number | null>(null); const gradientId = React.useId().replace(/:/g, ""); const tooltipId = React.useId(); const color = positive ? "#10b981" : "#f43f5e"; const Arrow = positive ? ArrowUpRight : ArrowDownRight; const lastIndex = values.length - 1; const clamp = (index: number) => Math.min(lastIndex, Math.max(0, Math.round(index))); React.useEffect(() => { const node = localRef.current; if (!node || typeof IntersectionObserver === "undefined") { setDrawn(true); return; } const observer = new IntersectionObserver( ([entry]) => { if (entry?.isIntersecting) { setDrawn(true); observer.disconnect(); } }, { threshold: 0.35 }, ); observer.observe(node); return () => observer.disconnect(); }, []); // The resting tooltip waits for the line to finish drawing. React.useEffect(() => { if (!drawn) return; if (reduced) { setSettled(true); return; } const timer = window.setTimeout(() => setSettled(true), LINE_MS + 50); return () => window.clearTimeout(timer); }, [drawn, reduced]); const resting = settled && defaultActiveIndex !== null ? clamp(defaultActiveIndex) : null; const current = activeIndex !== undefined ? (activeIndex === null ? null : clamp(activeIndex)) : (picked ?? resting); const point = current === null ? undefined : pts[current]; const pick = (index: number | null) => { setPicked(index); onActiveIndexChange?.(index); }; const handlePointer = (event: React.PointerEvent<HTMLDivElement>) => { const box = event.currentTarget.getBoundingClientRect(); if (box.width === 0) return; const x = ((event.clientX - box.left) / box.width) * W; const index = clamp(((x - PAD_X) / (W - PAD_X * 2)) * lastIndex); if (index !== picked) pick(index); }; const handleKey = (event: React.KeyboardEvent<HTMLDivElement>) => { const from = current ?? lastIndex; let next: number | null | undefined; if (event.key === "ArrowRight") next = clamp(from + 1); else if (event.key === "ArrowLeft") next = clamp(from - 1); else if (event.key === "Home") next = 0; else if (event.key === "End") next = lastIndex; else if (event.key === "Escape") next = null; if (next === undefined) return; event.preventDefault(); pick(next); }; return ( <div ref={localRef} data-tsuna-id="area-tooltip-card" className={cn( "w-[340px] max-w-full rounded-[26px] bg-white p-5 text-zinc-950", "shadow-[0_30px_60px_-34px_rgba(15,23,42,0.35),0_0_0_1px_rgba(15,23,42,0.05)]", className, )} {...props} > <style>{CSS}</style> <span className="text-[13px] font-medium text-zinc-500">{label}</span> <div className="mt-1.5 flex flex-wrap items-center gap-x-3 gap-y-1"> <span className="text-[34px] leading-none font-semibold tabular-nums tracking-[-0.04em]"> {value} </span> {delta ? ( <span className={cn( "inline-flex items-center gap-0.5 rounded-full px-2 py-1 text-[12px] font-semibold tabular-nums", positive ? "bg-emerald-50 text-emerald-700" : "bg-rose-50 text-rose-700", )} > <Arrow aria-hidden className="size-3.5" strokeWidth={2.6} /> {delta} </span> ) : null} </div> <div role="img" tabIndex={0} aria-label={`${label} trend, ${values.length} points${ dates[0] && dates[lastIndex] ? `, ${dates[0]} to ${dates[lastIndex]}` : "" }`} aria-describedby={point ? tooltipId : undefined} onPointerMove={handlePointer} onPointerDown={handlePointer} onPointerLeave={() => pick(null)} onFocus={() => { if (picked === null) pick(current ?? lastIndex); }} onBlur={() => pick(null)} onKeyDown={handleKey} className="relative mt-9 h-[104px] cursor-crosshair touch-pan-y rounded-[6px] outline-none focus-visible:ring-2 focus-visible:ring-zinc-900/35 focus-visible:ring-offset-4" > <svg aria-hidden viewBox={`0 0 ${W} ${H}`} preserveAspectRatio="none" className="absolute inset-0 block h-full w-full overflow-visible" > <defs> <linearGradient id={gradientId} x1="0" y1="0" x2="0" y2="1"> <stop offset="0%" stopColor={color} stopOpacity="0.2" /> <stop offset="100%" stopColor={color} stopOpacity="0.02" /> </linearGradient> </defs> <path d={area} fill={`url(#${gradientId})`} className="motion-reduce:!transition-none" style={{ opacity: drawn ? 1 : 0, transition: `opacity 900ms ${EASE} 200ms` }} /> <line x1={0} y1={BASE + 0.5} x2={W} y2={BASE + 0.5} stroke="#e4e4e7" strokeWidth={1} /> <path d={line} pathLength={100} fill="none" stroke={color} strokeWidth={2} strokeLinecap="round" strokeLinejoin="round" className="motion-reduce:!transition-none" style={{ strokeDasharray: "100 100", strokeDashoffset: drawn ? 0 : 100, transition: `stroke-dashoffset ${LINE_MS}ms ${EASE}`, }} /> </svg> {point && current !== null ? ( <> <span aria-hidden className="pointer-events-none absolute w-px -translate-x-1/2 bg-zinc-300 motion-reduce:!transition-none" style={{ left: `${(point.x / W) * 100}%`, top: point.y, height: BASE - point.y, transition: `left 160ms ${EASE}, top 160ms ${EASE}, height 160ms ${EASE}`, }} /> <span aria-hidden className="pointer-events-none absolute size-2.5 -translate-x-1/2 -translate-y-1/2 rounded-full ring-[3px] ring-white motion-reduce:!transition-none" style={{ left: `${(point.x / W) * 100}%`, top: point.y, backgroundColor: color, transition: `left 160ms ${EASE}, top 160ms ${EASE}`, }} /> <span id={tooltipId} role="tooltip" aria-live="polite" data-visible="" className="area-tooltip-card-tip pointer-events-none absolute -translate-x-1/2 rounded-full bg-zinc-950 px-2.5 py-1 text-[11.5px] leading-[16px] font-medium whitespace-nowrap text-white tabular-nums shadow-[0_8px_18px_-8px_rgba(15,23,42,0.5)] motion-reduce:!transition-none" style={{ left: `clamp(48px, ${(point.x / W) * 100}%, calc(100% - 48px))`, top: point.y - 36, transition: `left 160ms ${EASE}, top 160ms ${EASE}`, }} > {dates[current] ? <span className="text-zinc-400">{dates[current]} · </span> : null} {valuePrefix} {(values[current] ?? 0).toLocaleString("en-US")} {valueSuffix} </span> </> ) : null} </div> <div aria-hidden className="relative mt-2 h-[14px] text-[10.5px] leading-[14px] text-zinc-400 tabular-nums"> {ticks.map((index) => { const tick = pts[index]; const text = dates[index]; if (!tick || !text) return null; const edge = index === 0 ? "start" : index === lastIndex ? "end" : "middle"; return ( <span key={index} className={cn( "absolute top-0 whitespace-nowrap", edge === "middle" && "-translate-x-1/2", edge === "end" && "-translate-x-full", )} style={{ left: edge === "start" ? 0 : edge === "end" ? "100%" : `${(tick.x / W) * 100}%` }} > {text} </span> ); })} </div> </div> ); },); AreaTooltipCard.displayName = "AreaTooltipCard";
コンポーネント
エリアツールチップカード
14日ぶんの塗りつぶしエリアグラフに、控えめな基準線と日付の目盛り、ツールチップが付いた白い KPI カードです。画面に入ると面がふわっと現れ、上の線が左から描かれます。日にちにホバーするか、グラフにフォーカスして矢印キーを押すと、その日の日付と値が小さなツールチップに出ます。ラベル・値・増減・データ点・日付を差し替えて、ダッシュボードの一列や分析機能の紹介にそのまま置けます。
Verified Technical Spec
- アニメーション
- CSS / Tailwind
- Reduced motion
- 確認済み
- キーボードフォーカス
- 確認済み
- 対応環境
- Tailwind CSS v3.4 + v4 · React 19 / Next.js 15 App Router + Vite / Remix 対応
含まれるもの
- ソースを Cursor / Claude に渡してエージェントに組み込める
- React · TypeScript · Tailwind CSS · Lucide の完成 UI
依存パッケージ
- React 19.0.0
- Typescript 5.7.2
- Tailwindcss 3.4.16
- Lucide-react 1.23.0
技術スタック
- React
- TypeScript
- Tailwind CSS
- Lucide
バージョン 1.0.0