Area Tooltip Card
What is this?
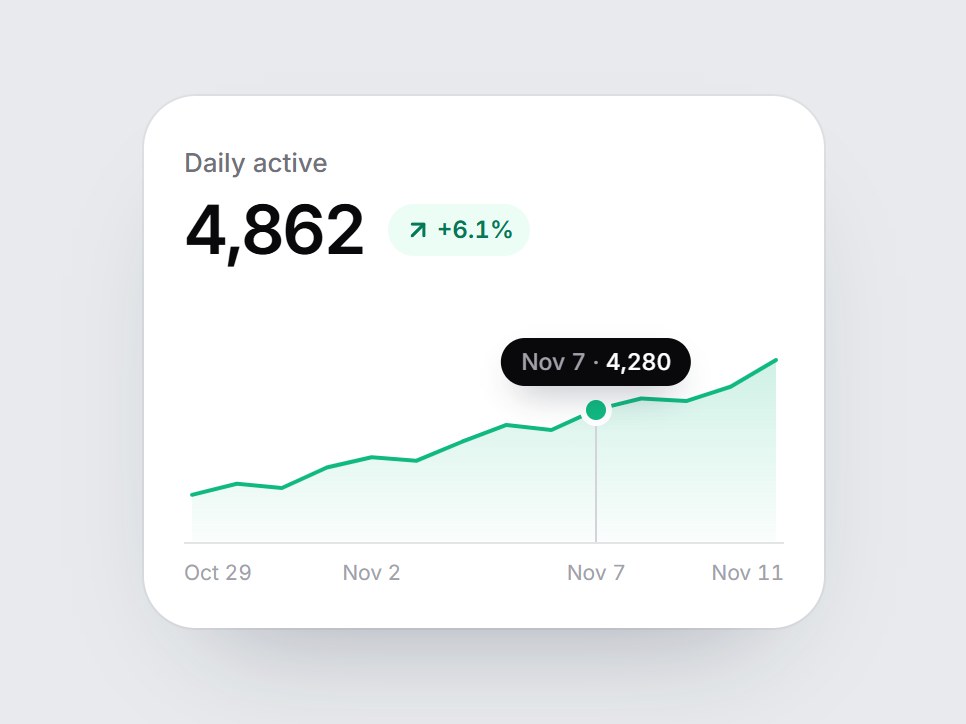
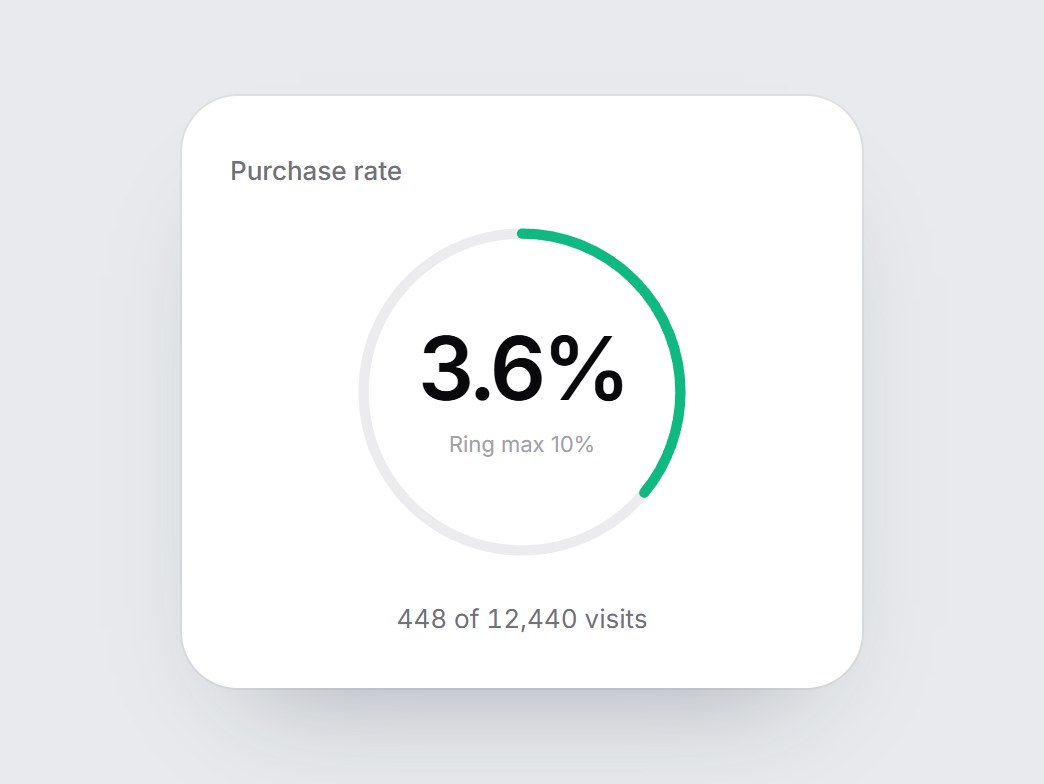
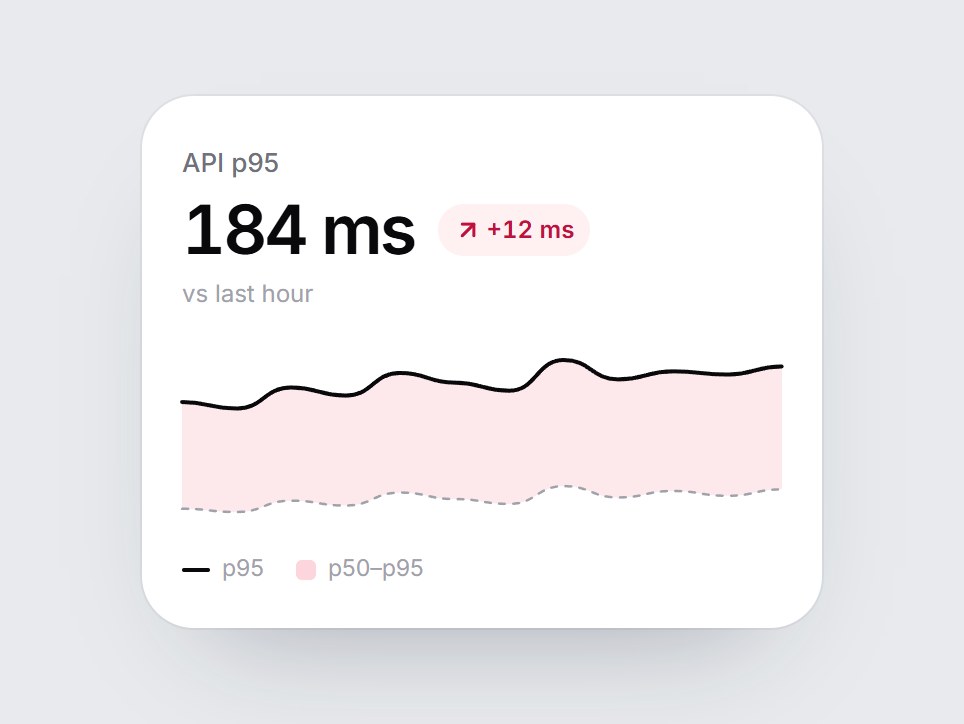
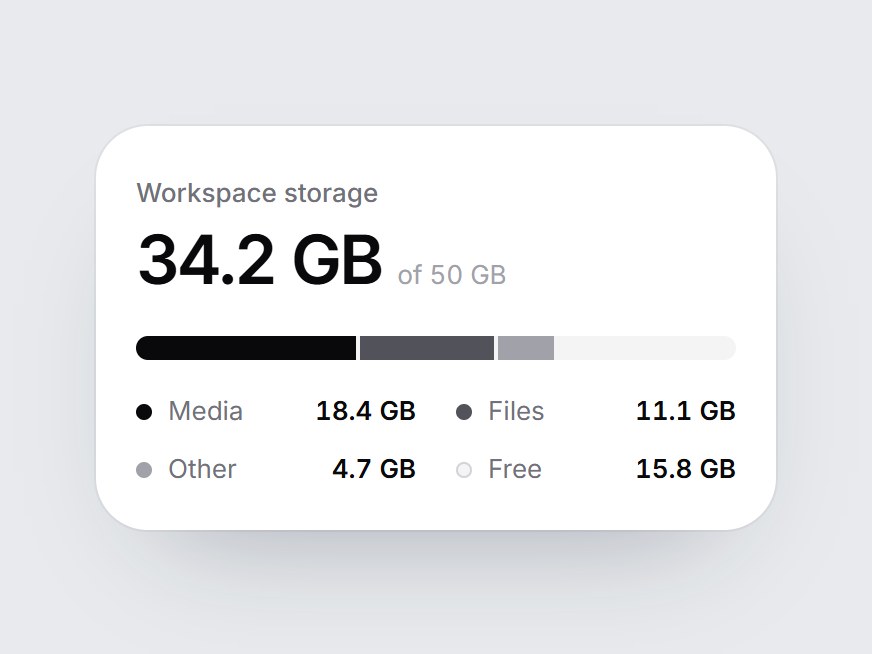
A white KPI tile with a fourteen-day filled area chart, a quiet baseline, a few date ticks, and a tooltip. When the card comes into view, the area fades in and the top line draws from left to right. Hover a day, or focus the chart and use the arrow keys, and a small tooltip shows that day's date and value. Swap the label, value, delta, points, and dates, then drop it into a dashboard row or an analytics feature grid.
Area Tooltip Card
A white KPI tile with a fourteen-day filled area chart, a quiet baseline, a few date ticks, and a tooltip. When the card comes into view, the area fades in and the top line draws from left to right. Hover a day, or focus the chart and use the arrow keys, and a small tooltip shows that day's date and value. Swap the label, value, delta, points, and dates, then drop it into a dashboard row or an analytics feature grid.
Verified Technical Spec
- Animation
- CSS / Tailwind
- Reduced motion
- Verified
- Keyboard focus
- Verified
- Compatibility
- Tailwind CSS v3.4 + v4 · React 19 / Next.js 15 App Router + Vite / Remix compatible
Included
- Copy source into Cursor or Claude for agent install
- Finished React · TypeScript · Tailwind CSS · Lucide UI
Dependencies
- React 19.0.0
- Typescript 5.7.2
- Tailwindcss 3.4.16
- Lucide-react 1.23.0
Tech Stack
- React
- TypeScript
- Tailwind CSS
- Lucide
Version 1.0.0