コンポーネント一覧へ戻る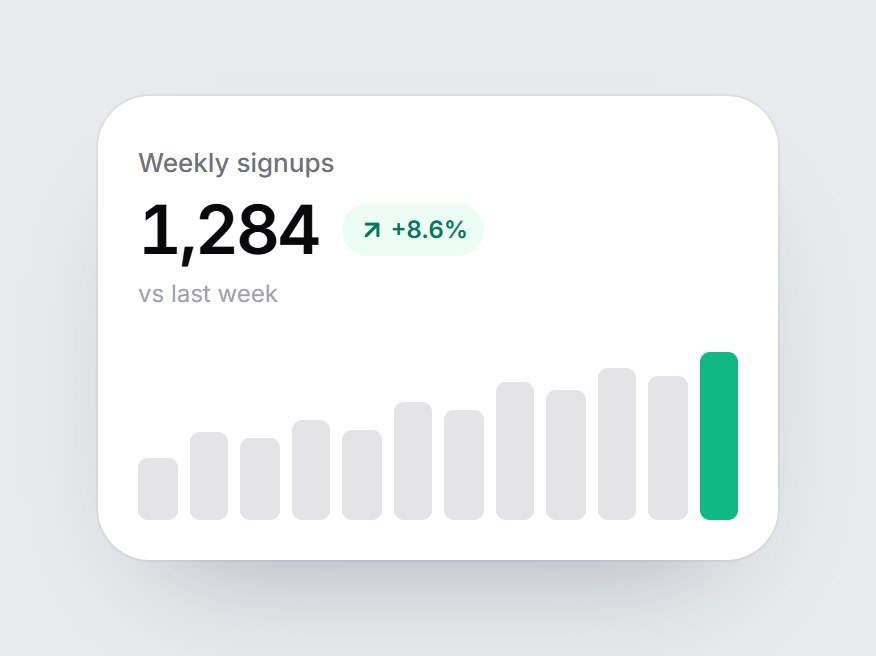
これは何か
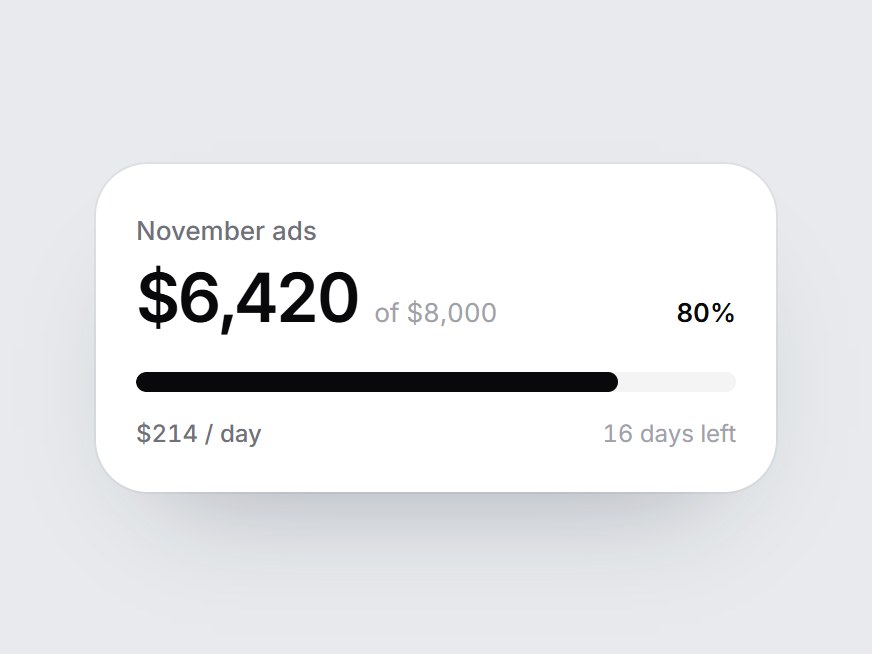
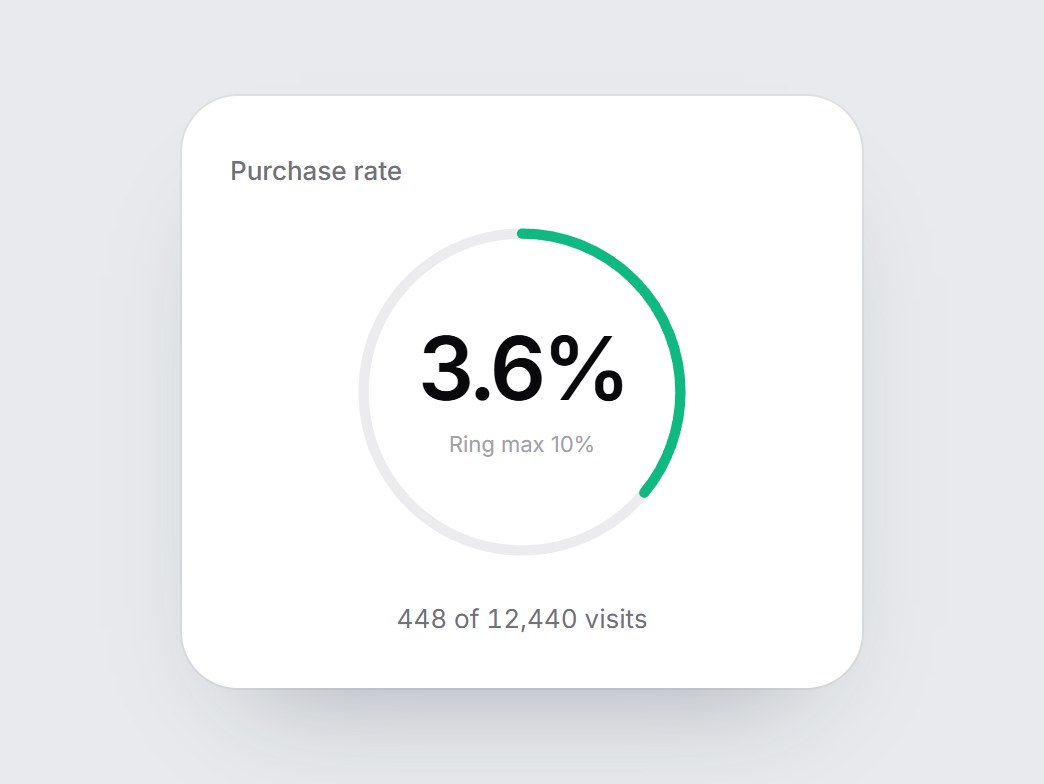
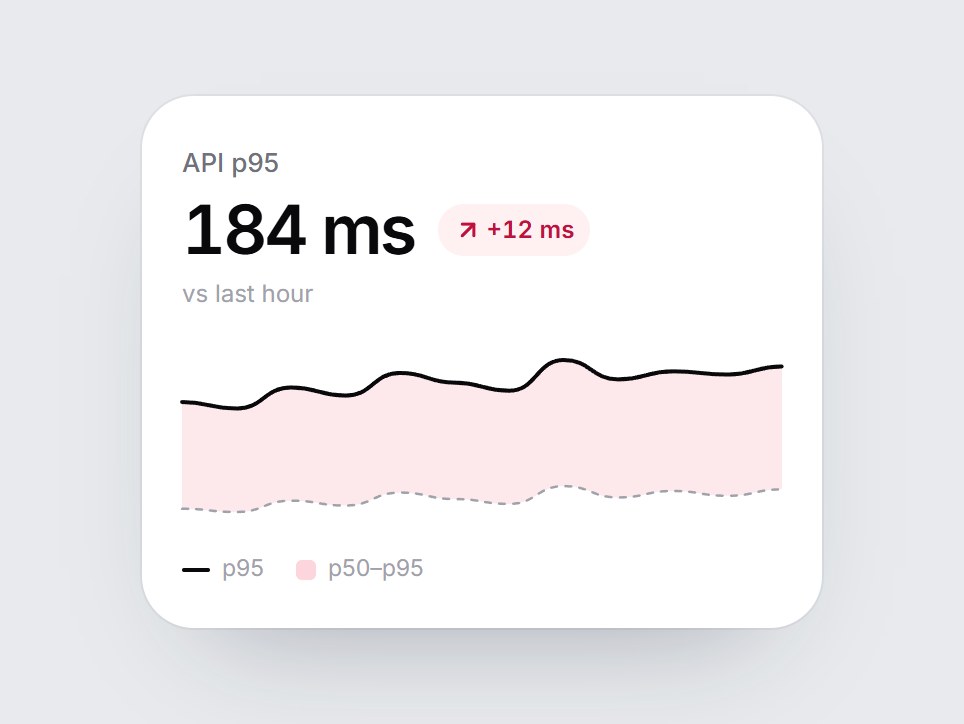
ラベル・大きな数字・増減の pill・12本の縦棒を並べた白い KPI カードです。画面に入ると棒が左から順に下から伸び、増減の pill がふわっと現れます。最後の棒は増減に合わせて緑か赤になります。ラベル・値・増減・データ点を差し替えて、ダッシュボードの一列や分析機能の紹介にそのまま置けます。
TSX の全文です。アカウントは不要です。
bar-kpi-card.tsx
"use client"; import * as React from "react";import { ArrowDownRight, ArrowUpRight } from "lucide-react";import { cn } from "@/lib/utils"; export const BAR_KPI_DEFAULT_POINTS: readonly number[] = [ 62, 70, 68, 74, 71, 80, 77, 86, 84, 91, 88, 96,]; export type BarKpiCardProps = React.ComponentPropsWithoutRef<"div"> & { label: string; /** Pre-formatted figure, e.g. "1,284". */ value: React.ReactNode; /** Change text, e.g. "+8.6%". */ delta?: string; /** Green up arrow and green last bar when true, red when false. */ positive?: boolean; /** Oldest first. One bar per value. */ points?: readonly number[]; /** Caption under the figure, e.g. "vs last week". */ comparison?: string; /** Unit used in the chart's aria-label, e.g. "weeks". */ periodLabel?: string;}; const EASE = "cubic-bezier(0.22, 1, 0.36, 1)";const BAR_MS = 800;const STAGGER_MS = 80; /** * Bar heights in percent. The floor sits below the smallest value, * so a steady series still shows its week-to-week change. */function barHeights(values: readonly number[]) { const min = Math.min(...values); const max = Math.max(...values); const span = max - min; if (span === 0) return values.map(() => 100); const floor = min - span * 0.6; return values.map((v) => Math.round(((v - floor) / (max - floor)) * 1000) / 10);} export const BarKpiCard = React.forwardRef<HTMLDivElement, BarKpiCardProps>( ( { label, value, delta, positive = true, points = BAR_KPI_DEFAULT_POINTS, comparison = "vs last week", periodLabel = "weeks", className, ...props }, ref, ) => { const values = points.length >= 1 ? points : BAR_KPI_DEFAULT_POINTS; const heights = React.useMemo(() => barHeights(values), [values]); const localRef = React.useRef<HTMLDivElement>(null); React.useImperativeHandle(ref, () => localRef.current as HTMLDivElement); const [drawn, setDrawn] = React.useState(false); const color = positive ? "#10b981" : "#f43f5e"; const Arrow = positive ? ArrowUpRight : ArrowDownRight; React.useEffect(() => { const node = localRef.current; if (!node || typeof IntersectionObserver === "undefined") { setDrawn(true); return; } const observer = new IntersectionObserver( ([entry]) => { if (entry?.isIntersecting) { setDrawn(true); observer.disconnect(); } }, { threshold: 0.35 }, ); observer.observe(node); return () => observer.disconnect(); }, []); return ( <div ref={localRef} data-tsuna-id="bar-kpi-card" className={cn( "w-[340px] max-w-full rounded-[26px] bg-white p-5 text-zinc-950", "shadow-[0_30px_60px_-34px_rgba(15,23,42,0.35),0_0_0_1px_rgba(15,23,42,0.05)]", className, )} {...props} > <span className="text-[13px] font-medium text-zinc-500">{label}</span> <div className="mt-1.5 flex flex-wrap items-center gap-x-3 gap-y-1"> <span className="text-[34px] leading-none font-semibold tabular-nums tracking-[-0.04em]"> {value} </span> {delta ? ( <span className={cn( "inline-flex items-center gap-0.5 rounded-full px-2 py-1 text-[12px] font-semibold tabular-nums motion-reduce:!transition-none", positive ? "bg-emerald-50 text-emerald-700" : "bg-rose-50 text-rose-700", )} style={{ opacity: drawn ? 1 : 0, transition: `opacity 400ms ${EASE} 400ms` }} > <Arrow aria-hidden className="size-3.5" strokeWidth={2.6} /> {delta} </span> ) : null} </div> {delta && comparison ? ( <span className="mt-1.5 block text-[12px] text-zinc-400">{comparison}</span> ) : null} <div role="img" aria-label={`${label}, ${values.length} ${periodLabel}`} className="mt-5 flex h-[84px] items-end gap-[6px]" > {heights.map((height, index) => ( <span key={index} className="min-w-0 flex-1 origin-bottom rounded-[5px] motion-reduce:!transition-none" style={{ height: `${height}%`, backgroundColor: index === heights.length - 1 ? color : "#e4e4e7", transform: `scaleY(${drawn ? 1 : 0})`, transition: `transform ${BAR_MS}ms ${EASE} ${index * STAGGER_MS}ms`, }} /> ))} </div> </div> ); },); BarKpiCard.displayName = "BarKpiCard";
コンポーネント
バー KPI カード
ラベル・大きな数字・増減の pill・12本の縦棒を並べた白い KPI カードです。画面に入ると棒が左から順に下から伸び、増減の pill がふわっと現れます。最後の棒は増減に合わせて緑か赤になります。ラベル・値・増減・データ点を差し替えて、ダッシュボードの一列や分析機能の紹介にそのまま置けます。
Verified Technical Spec
- アニメーション
- CSS / Tailwind
- Reduced motion
- 確認済み
- キーボードフォーカス
- ソース上では未検出
- 対応環境
- Tailwind CSS v3.4 + v4 · React 19 / Next.js 15 App Router + Vite / Remix 対応
含まれるもの
- ソースを Cursor / Claude に渡してエージェントに組み込める
- React · TypeScript · Tailwind CSS · Lucide の完成 UI
依存パッケージ
- React 19.0.0
- Typescript 5.7.2
- Tailwindcss 3.4.16
- Lucide-react 1.23.0
技術スタック
- React
- TypeScript
- Tailwind CSS
- Lucide
バージョン 1.0.0